
Overview
The FOMC kept interest rates unchanged for a third consecutive meeting at 3.6%. A resilient economy and persistent inflation risks led markets to price out rate cuts for the remainder of the year, keeping U.S. Treasury yields elevated. U.S. equities posted their strongest monthly performance since 2020, supported by AI-driven investment and strong technology earnings.
The U.S. dollar weakened, while the euro strengthened, and energy-linked currencies led gains. Oil prices remained elevated and continued to fluctuate in response to developments surrounding the U.S./Israel-Iran conflict. Gold has deviated from its traditional safe-haven role and continues to experience short-term weakness as investors face liquidity pressures.
Bitcoin advanced this month, supported by renewed risk-on sentiment and a large purchase by Strategy Inc. However, a multi-billion-dollar hack reduced risk appetite across DeFi, driving borrowing rates higher and prompting capital reallocation across digital assets. RAAC continues to offer attractive yields across its Curve pools and has expanded its offering of iREET through the launch of a new bond.
Macroeconomic & Traditional Finance Outlook
United States
The Federal Open Market Committee (FOMC) left interest rates unchanged at 3.50%–3.75%. The Fed was divided, with four dissenting votes, including three voting members adopting a more hawkish stance amid persistent inflation concerns. While markets continue to expect rates to remain on hold, they have begun pricing in the possibility of rate hikes in 2027.
The U.S. economy grew 2% in the first quarter, supported by strong AI-driven investment and resilient consumer spending. Inflation data came in broadly in line with expectations, elevated, but not accelerating, with companies appearing to absorb costs from the recent energy shock, at least for now. With the labour market continuing to show resilience, markets remain caught between inflationary pressure driven by economic strength and geopoliticals, reinforcing expectations for a higher-for-longer interest rate environment.
Table 1: US Indicators
| Indicator | Period | Actual | Previous | Consensus |
|---|---|---|---|---|
| GDP | Q1 | 2.0% | 0.5% | 2.3% |
| Unemployment | Mar | 4.3% | 4.4% | 4.4% |
| Core CPI (YoY) | Mar | 2.6% | 2.5% | 2.7% |
| 1YR Inflation Expectations | Apr | 4.7% | 3.8% | 4.8% |
Source: tradingeconomics
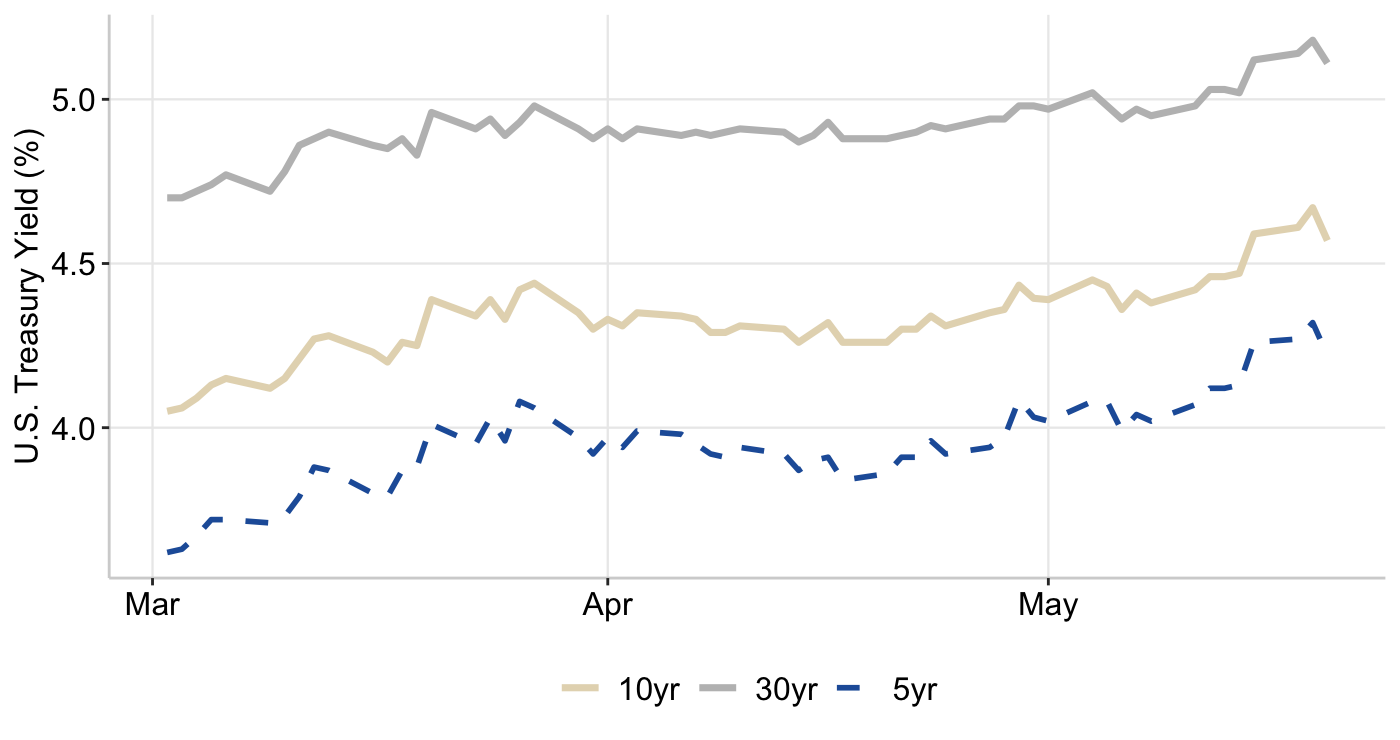
Treasury bonds remained elevated relative to pre-war levels. U.S. Treasury yields initially declined on news of U.S./Israel-Iran negotiations, but quickly reversed following ceasefire violations and the lack of meaningful progress toward a peace agreement.
U.S. 10-year Treasury yields reached 4.41%, marking a one-month high as investors reassessed the interest rate outlook amid rising geopolitical uncertainty. Short-term Treasury yields, which remain highly sensitive to Fed expectations, also moved higher as markets priced out rate cuts in 2026 following the FOMC’s hawkish tone. Market positioning is now shifting away from a peace-and-rate-cuts narrative toward expectations of a prolonged conflict and a higher inflation regime.
Graph 1: U.S. 5-Year & 10-Year Treasury Yields
Source: FRED
Credit spreads have now narrowed as market conditions stabilized, supported by improving risk sentiment amid a de-escalation of the war. Spreads averaged 0.82 in April, lower than the previous month. However, investors are increasingly rotating out of private credit and into public bond markets. Ongoing liquidity constraints, as private credit funds limit withdrawals, are eroding the illiquidity premium and making bond funds more attractive. At the same time, private credit’s heavy exposure to software companies, combined with rising concerns around AI-driven disruption, is contributing to higher perceived credit risk
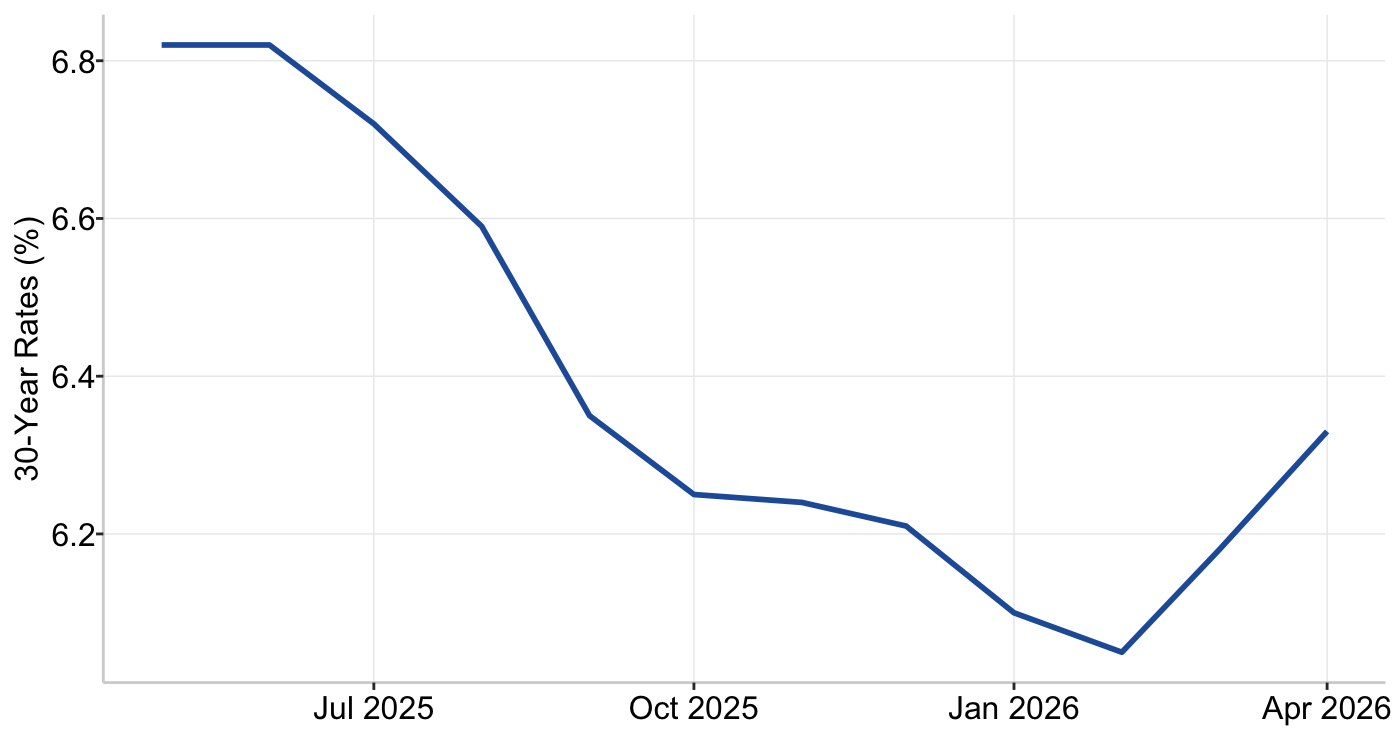
U.S. mortgage rates averaged 6.34% in April, but have declined for three consecutive weeks. This has provided modest relief to the housing market, with pending home sales showing slight improvement. However, activity remains below year-ago levels, and housing affordability continues to be strained.
Graph 2: US 30-Year Mortgage Rates
Source: FRED
Equities
U.S. equities climbed to record highs, capping their strongest monthly performance since 2020. The S&P 500 reached 7,200 in April, while the Nasdaq-100 rose to 27,000, supported by economic resilience, a surge in AI-driven investment, and strong earnings reports. As geopolitical risk premiums were gradually priced out, capital rotated back into risk assets. Geopolitical concerns temporarily took a back seat as markets positioned for a diplomatic resolution, with investors' focus shifting back toward AI-led growth and strong corporate fundamentals, pushing equities to record highs with technology and consumer stocks leading the rally.
However, momentum briefly slowed as investors awaited major technology earnings and central bank decisions. Technology stocks experienced a short-term selloff, driven by renewed doubts over the sustainability of the AI-driven rally. At the same time, U.S. negotiations failed to produce meaningful progress, triggering a negative market reaction
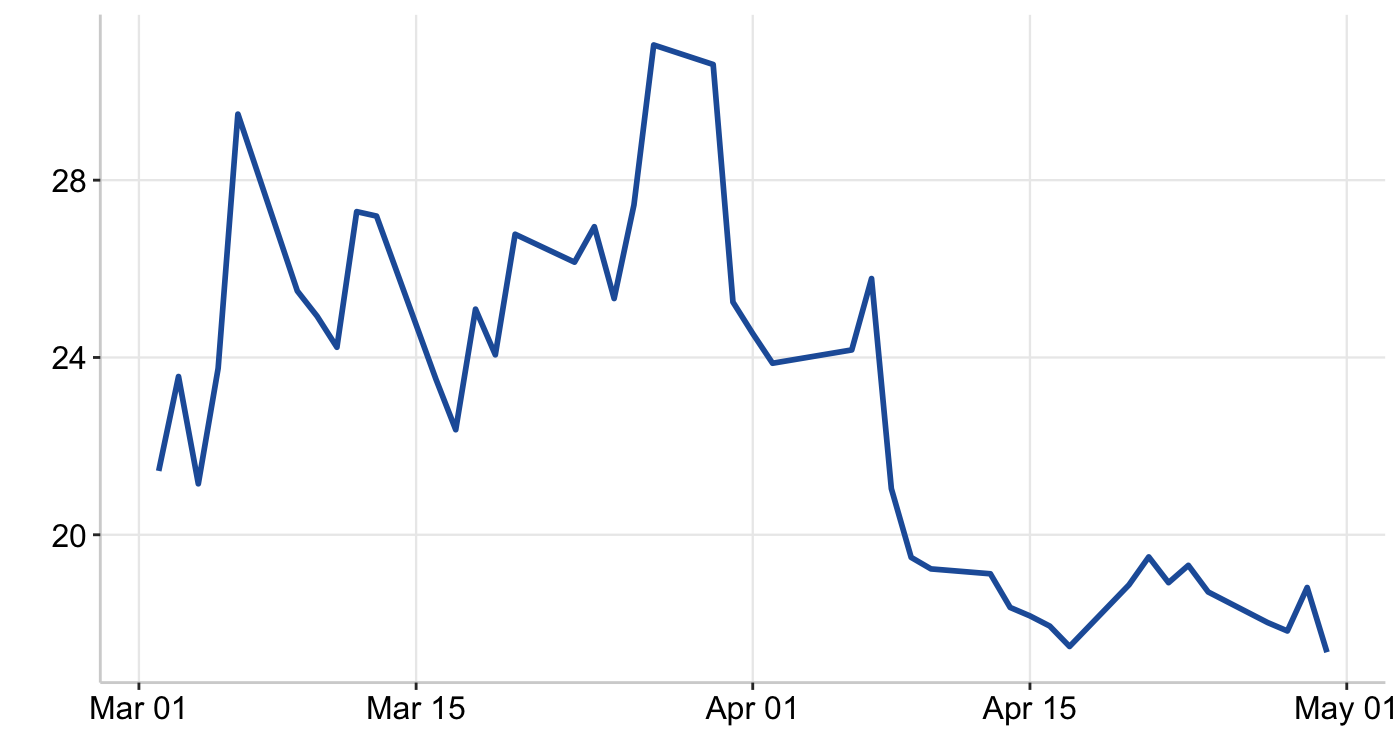
Graph 3: CBOE SPX Volatility Index
Source: FRED
Notes: The Volatility Index (VIX) returned to pre-war levels. Additionally, investors unwound positions ahead of the weekend to reduce risk, leading to recurring volatility patterns as key developments in the conflict tend to occur over weekends.
While markets remain optimistic, confidence is still fragile, with investors continuing to buy the dip out of fear of missing out. However, elevated volatility and the risk of short-term pullbacks remain highly likely.
World Currencies
The U.S. dollar fell following the Iran ceasefire, erasing all of its 2026 gains as other major currencies strengthened. Easing inflation concerns, reduced expectations of rate hikes, and the rapid unwinding of positions have all weighed on the dollar. The Middle East conflict may be structurally weakening the dollar’s global dominance, accelerating a shift toward gold and alternative systems.
Investors are moving into energy-linked currencies due to rising oil prices from the conflict. The Norwegian krone and Australian dollar are leading gains as these countries benefit from exporting energy and commodities.
Table 2: World Currencies Performance (Month-to-Date)
| USD | EUR | GBP | JPY | CAD | |
|---|---|---|---|---|---|
| USD | -1.5% | -2.6% | -1.3% | -2.2% | |
| EUR | 1.5% | -1.1% | 0.2% | -0.7% | |
| GBP | 2.7% | 1.1% | 1.4% | 0.4% | |
| JPY | 1.3% | -0.2% | -1.3% | -0.9% | |
| CAD | 2.2% | 0.7% | -0.4% | 0.1% |
Source: Koyfin
The euro has also been one of the best-performing major currencies this month. Despite Europe’s reliance on imported energy and an initial decline following higher oil prices, the euro has since stabilized, with volatility and hedging costs returning to normal levels as markets become less reactive to geopolitical risk. In contrast, the yen has weakened after the Bank of Japan signaled growing uncertainty around the timing of future rate hikes, while higher oil prices continue to place additional downward pressure on the currency.
Real-World Assets (RWA) Outlook
RAAC backs its financial products with real-world assets (RWA), offering greater stability. The following section reviews the current market performance of each underlying asset.
Real Estate Environment
On the demand side, elevated mortgage rates continue to constrain buyer activity, while shelter inflation, up 3.0% over the past 12 months, reinforces the need for strategic property acquisition. On the supply side, higher construction costs have limited new development, with homebuilder sentiment weakening as rising input costs make pricing uncertain. Lastly, a persistent imbalance in the U.S. housing market has resulted in an estimated shortage of roughly 10 million homes, which remains the primary driver of elevated home prices and ongoing affordability challenges.
Commodities overview
Global commodity prices are expected to rise by approximately 16% in 2026, driven primarily by supply disruptions stemming from the U.S.-Israel-Iran conflict. In addition, the United Arab Emirates is set to leave the Organization of the Petroleum Exporting Countries on May 1, a move that could weaken OPEC’s ability to influence global oil prices. Over the long term, this may contribute to increased supply and lower energy prices. However, the impact is unlikely to be felt in the near term, as war-driven supply shocks and geopolitical risk premiums continue to keep oil prices elevated.
Oil markets have remained extremely tight, reinforcing inflationary pressures amid a significant supply shock tied to restricted flows through the Strait of Hormuz, which accounts for 20% of global supply. Prices declined below $100/barrel (WTI) on optimism of peace-talks. However, oil prices surged above $112/barrel (WTI) as markets reacted to escalating military tensions and failed negotiations. Oil remains 30–35% higher since the onset of the conflict.
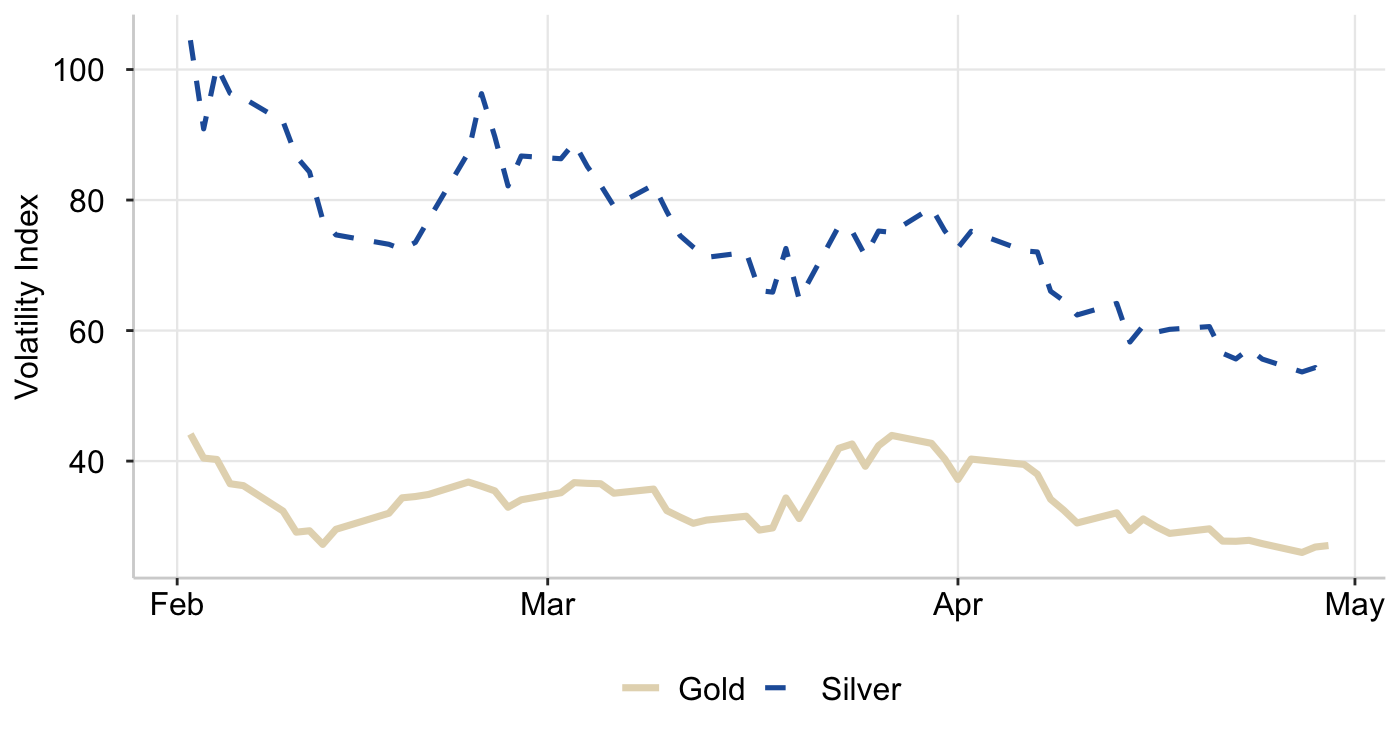
Gold is experiencing short-term weakness, with prices remaining range-bound between $4,500 and $4,900 throughout April. A stronger U.S. dollar has made gold more expensive, while its status as a non-yielding asset increases the opportunity cost of holding it in a higher-rate environment. Gold continues to deviate from its safe-haven role, as some investors are selling positions due to liquidity pressures.
Graph 4: CBOE Gold/Silver ETF Volatility Index
Source: CBOE
However, the People's Bank of China has been actively accumulating gold following the recent price decline, helping to support market confidence and reinforce gold’s long-term role. Ongoing central bank demand, alongside broader de-dollarization trends, continues to provide structural support for gold.
The silver market is tightening due to falling supply and rising safe-haven demand. However, industrial demand for silver as an input is weakening, reflecting a broader economic slowdown. Despite softer industrial use, silver’s sensitivity to ongoing geopolitical developments is likely to support higher prices through 2026.
Decentralized Finance (DeFi) Outlook
Cryptocurrencies
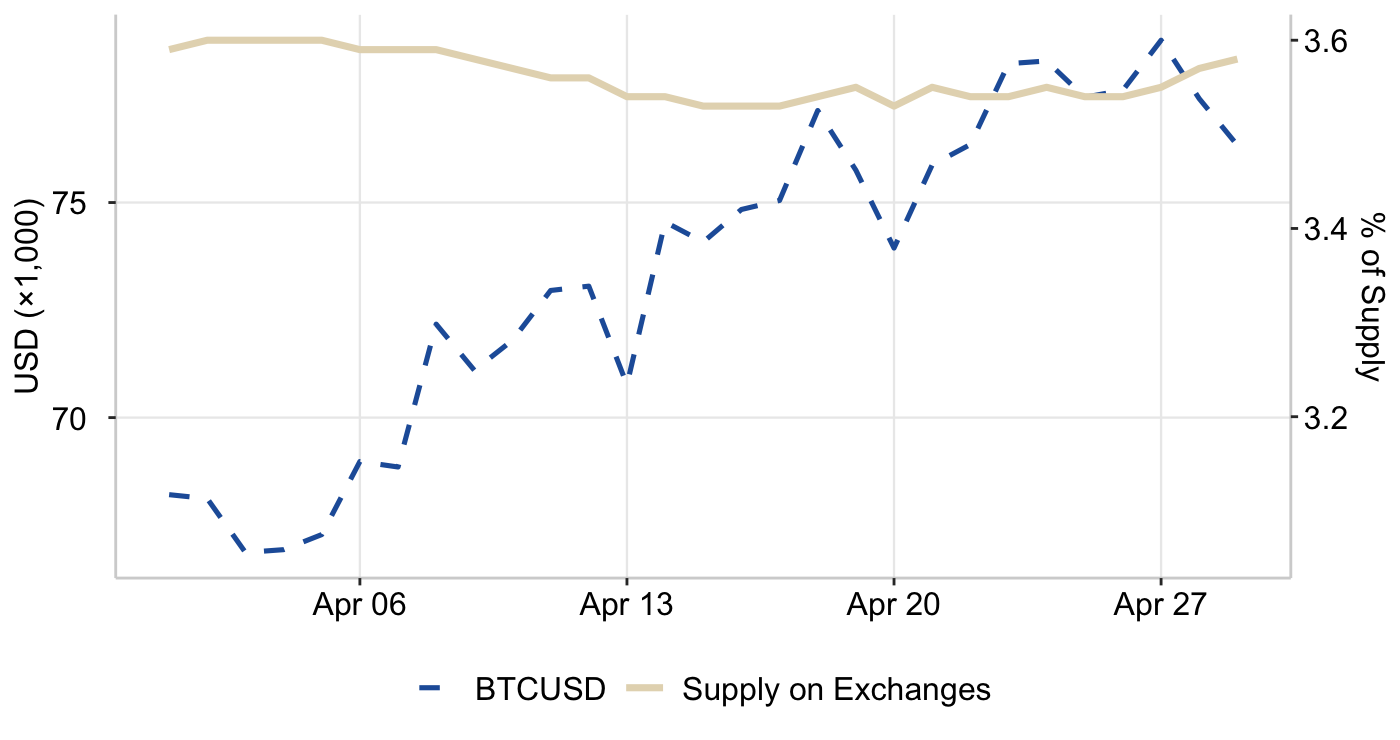
Bitcoin (BTC) and Ethereum (ETH) gained 14% and 12% this month, respectively, driven by renewed risk-on sentiment, the unwinding of leveraged positions, and a large purchase by Strategy Inc. Both assets moved higher as investor sentiment improved on optimism surrounding a potential ceasefire. Bitcoin, in particular, continued to trade closely with equities, maintaining a correlation of approximately 0.70, and remained largely driven by broader macro sentiment
Bitcoin broke above key resistance levels near $76,000, forcing short sellers to cover positions and accelerating upside momentum, while also increasing the risk of a short squeeze. Strategy Inc. made its largest Bitcoin purchase since 2024, acquiring $4.1 billion worth of BTC over the month of April and increasing its holdings to approximately $61 billion. The scale of this accumulation has supported market demand and helped push Bitcoin closer to the $80,000 level. If current momentum persists, analysts increasingly view this as the early stages of a broader bullish trend rather than a temporary price spike
Graph 6: BTCUSD & Percentage of Supply on Exchanges
Source: Thetie
Crypto continues to integrate with off-chain activity through both regulation and infrastructure. In Europe, a regulatory dispute is emerging, with the European Union seeking to centralize oversight under the European Securities and Markets Authority (ESMA), while Malta opposes the move, arguing it would undermine its position as a leading crypto hub despite the EU’s push for standardization and stronger investor protection. In the U.S., Donald Trump has taken a pro-crypto stance, supporting initiatives like the Clarity Act to advance regulation.
At the same time, crypto hedge funds are using blockchain infrastructure to trade traditional assets such as oil, gold, and equities, aiming to exploit pricing inefficiencies. While this presents new risks, it highlights how crypto systems are being repurposed to enhance efficiency in traditional markets.
Stablecoins
Stablecoins are cryptocurrencies that are commonly held because they offer lower volatility than Bitcoin and Ethereum, allowing users to preserve capital while remaining active on-chain. RAAC issues its own stablecoin, Precious-Metal USD (pmUSD), which operates on the Ethereum blockchain.
Table 3: 1 Month Market Capitalization
| Stablecoin | Position | Market Capitalization |
|---|---|---|
 pmUSD pmUSD |
53 | $100.20M |
 USDT USDT |
1 | $189.48B |
 USDC USDC |
2 | $77.34B |
 PYUSD PYUSD |
7 | $3.379B |
 crvUSD crvUSD |
28 | $296.24M |
 frxUSD frxUSD |
45 | $134.17M |
 OUSD OUSD |
147 | $5.65M |
Source: DefiLlama
The Ethereum network hosts approximately $163 billion in stablecoin supply, representing roughly 52% of the global market, and continues to serve as the dominant blockchain for stablecoin issuance and activity. U.S. dollar–pegged stablecoins Tether (USDT) and USD Coin (USDC) remain the largest within the ecosystem, accounting for 83% of the activity.
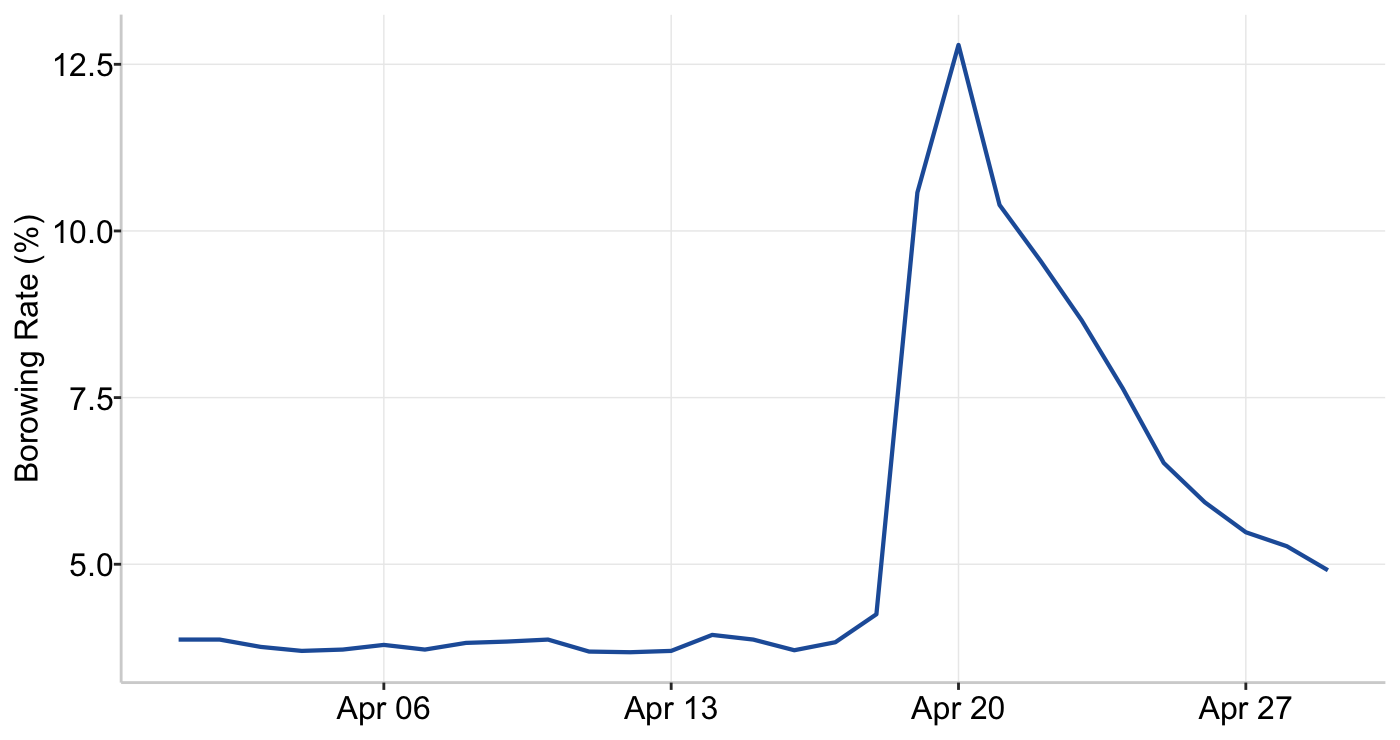
The Ethereum stablecoin borrowing rate represents the average cost of borrowing across lending protocols on the Ethereum network. Towards the middle of the month, the borrowing rate spiked to 11.45% before gradually declining.
Graph 7: Ethereum Stablecoin Borrowing Rate
Source: Blockworks
KelpDAO created fraudulent collateral that was used to drain $293 billion in funds from Aave. The event quickly spread systemic risk across on-chain ecosystems, triggering a sharp spike in borrowing rates. In response, major players like Lido and EtherFi coordinated a bailout-style effort to restore collateral backing to prevent further market damage. However, undermines DeFi’s core promise of decentralization and introduces moral hazard by shielding users from losses.
The global financial system continues to converge with blockchain technology, driven by the rising adoption of stablecoins as a global payment mechanism. Cross-border business payments using stablecoins are projected to grow to $5 trillion by 2035. Stablecoins are an attractive alternative as they offer faster, cheaper, and programmable transactions compared to traditional banking systems.
This structural shift has attracted traditional financial institutions, which are entering the space through strategic acquisitions and partnerships to capture emerging opportunities. Better Home & Finance Holding Co. and Coinbase Global Inc. have launched a product that allows borrowers to use crypto as collateral for a home down payment. The structure enables users to take out a secondary loan backed by assets such as Bitcoin or USDC, allowing them to access housing liquidity without selling their crypto holdings. Moreover, Western Union is preparing to launch a Solana-based stablecoin, USDPT, marking a notable step in the integration of stablecoins into traditional financial infrastructure.
Glimpse into the Curve Wars
RAAC is built directly within Curve Finance and actively participates in the Curve Wars—the ongoing competition to control governance power within the protocol. By locking CRV tokens, participants receive vote-escrowed CRV (veCRV), which grants voting rights to determine which liquidity pools receive reward emissions, ultimately shaping yield levels and liquidity depth. Protocols such as Convex Finance and Stake DAO have accumulated significant veCRV positions and, through their own tokens, offer alternative pathways to access Curve governance power.
The Kingmaker Ratio is a RAAC-specific metric used to evaluate whether acquiring veCRV directly or accumulating voting power through another protocol is the most efficient strategy per dollar. The metric is defined as:
Kingmaker Ratio = veCRV/$ via protocol iveCRV/$ via CRV
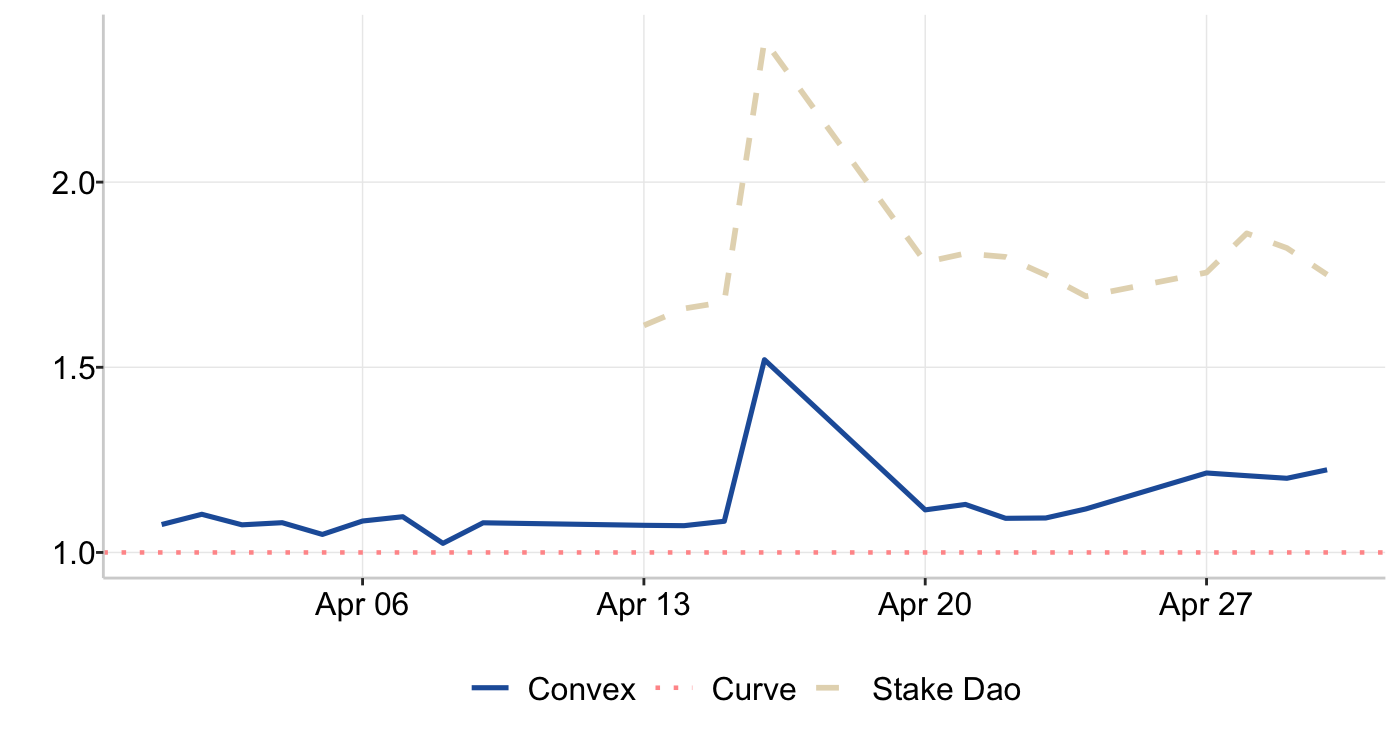
Using the above equation, separate ratios are calculated for Curve (veCRV), Convex (vlCVX), and StakeDao (sdCRV + veSDT). Graph 8 tracks the evolution of these ratios over the month of April, highlighting changes in relative efficiency across each strategy.
Graph 8: Kingmaker Ranking
Source: buycvxcorrect.netlify.app, coingecko
The ratios are above 1.00, indicating that acquiring vlCVX or (sdCRV + veSDT) is more efficient than directly purchasing veCRV. However, accumulation through Stake Dao provides higher voting power per $1 spent compared to Convex.
To date, RAAC has leveraged the Convex strategy, which has still enabled significant voting influence. RAAC now indirectly controls approximately 4.1% of Curve Finance’s voting power, making it the fourth-largest governance participant. This positioning allows RAAC to consistently direct emissions toward its own liquidity pools, creating a structural advantage that supports sustainable and predictable yields.
RAAC Outlook
Precious-Metal USD (pmUSD)
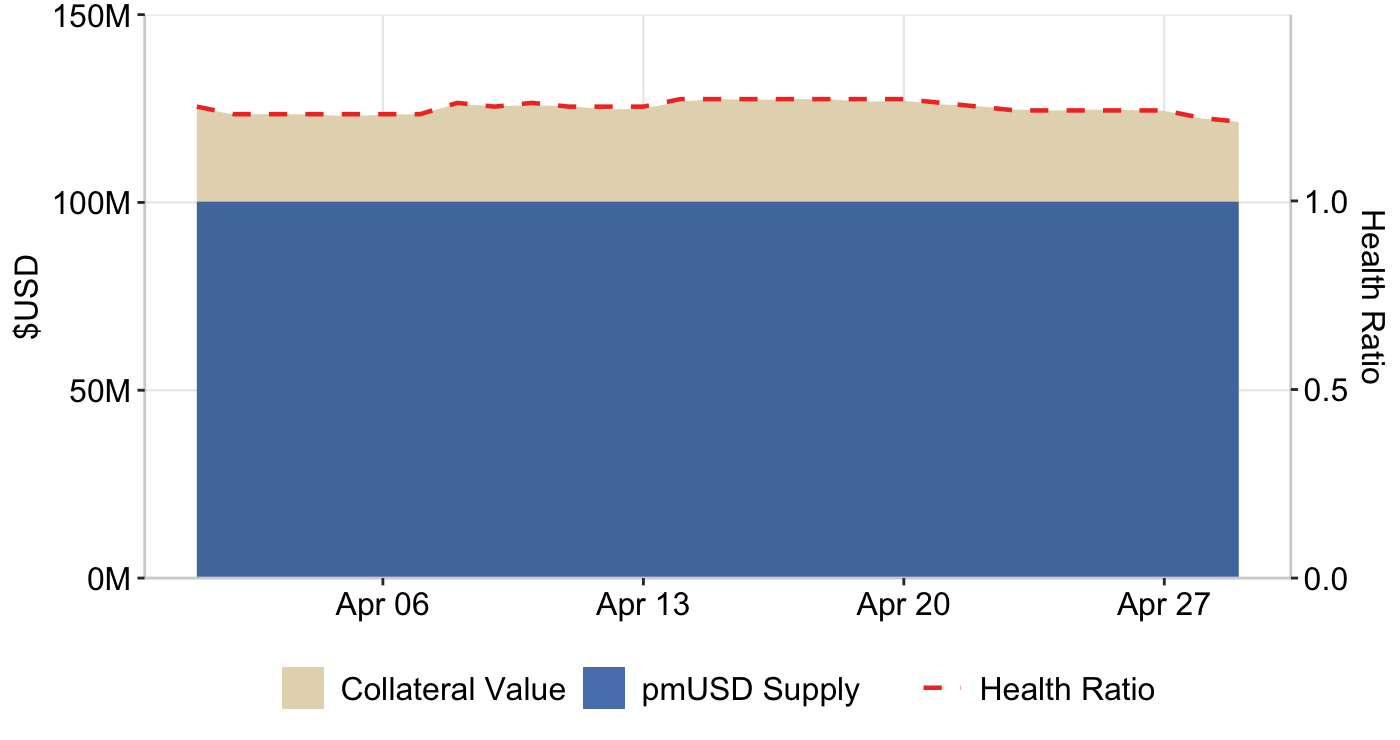
Precious-Metal USD (pmUSD) is RAAC’s stablecoin built on the Ethereum network. Minting began in late 2025 and is supported by $121.98 million in collateral provided by I-ON, reinforcing its asset-backed structure. Currently, pmUSD has 432 holders and a market capitalization of $100.2M, ranking it as the 52nd largest stablecoin on Ethereum.
Through gold price appreciation and active asset management by RAAC, pmUSD maintains a stable health ratio relative to its collateral value and circulating supply.
Table 9: Collateral vs pmUSD supply
Source: https://dune.com/4sh4/raac-pmusd
iREET
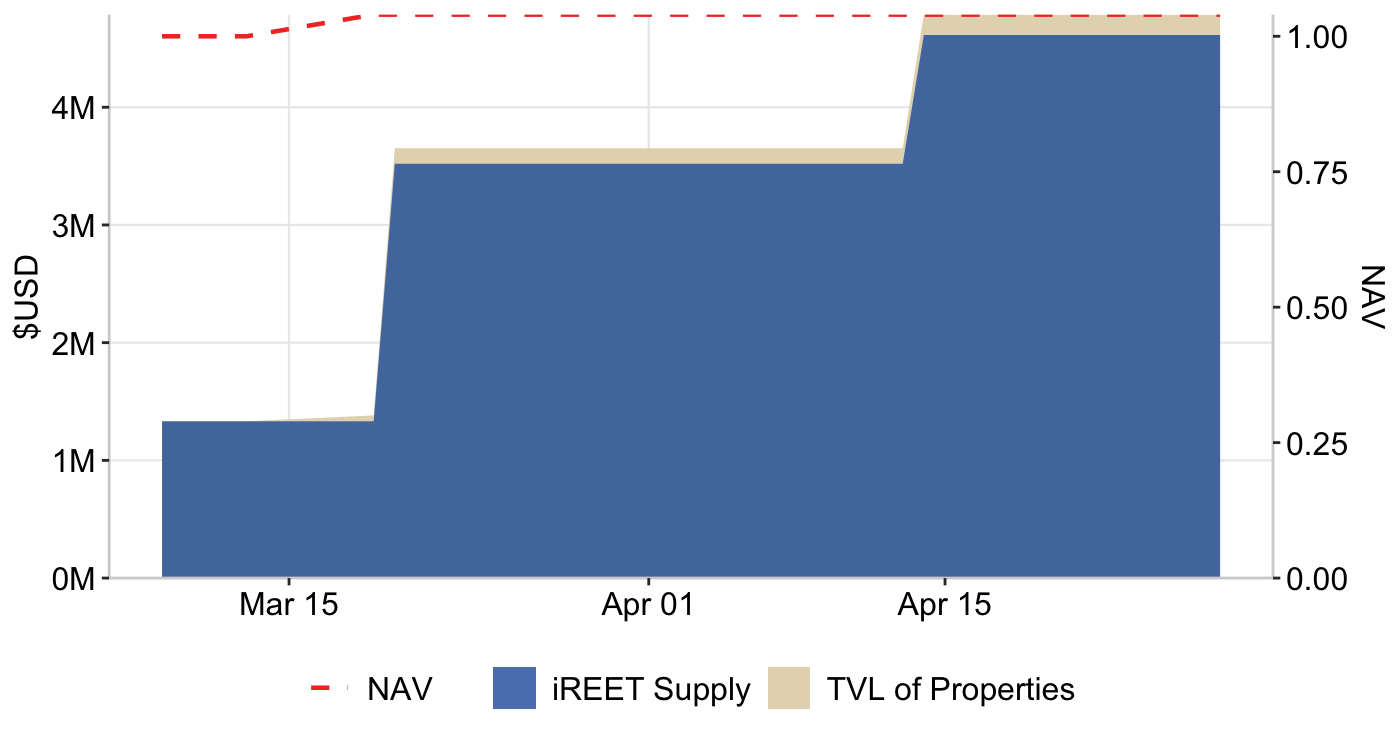
The Index Real Estate Token (iREET) is a tokenized real estate index that provides users with exposure to a diversified portfolio of properties through a single token. The iREET vault currently holds 14 properties with a combined value of $4.79 million, supporting a circulating supply of 4.61 million iREET tokens. In addition, these properties generate approximately $32K in monthly rental income, helping to further stabilize the protocol.
Graph 10: NAV per $iREET
Source: Dune
Notes: NAV per $iREET = TVL / Circulating Supply
On April 15, RAAC launched an iREET bond in partnership with ApeBond. The offering proved effective, selling out by April 18 and raising $1.10M. The bond provided users with a base reward of 3%, with an additional 2–4% yield available for a 45-day lock period. This marks continued growth as the protocol prepares for the launch of RAAClend.
Liquidity pools
RAAC has 4 liquidity pools active on Curve Finance:
- pmUSD/crvUSD - Launched Dec 25, 2025
- pmUSD/frxUSD - Launched Dec 25, 2025
- pmUSD/OUSD - Launched Feb 28, 2026
- iREET/pmUSD - Launched Mar 12, 2026
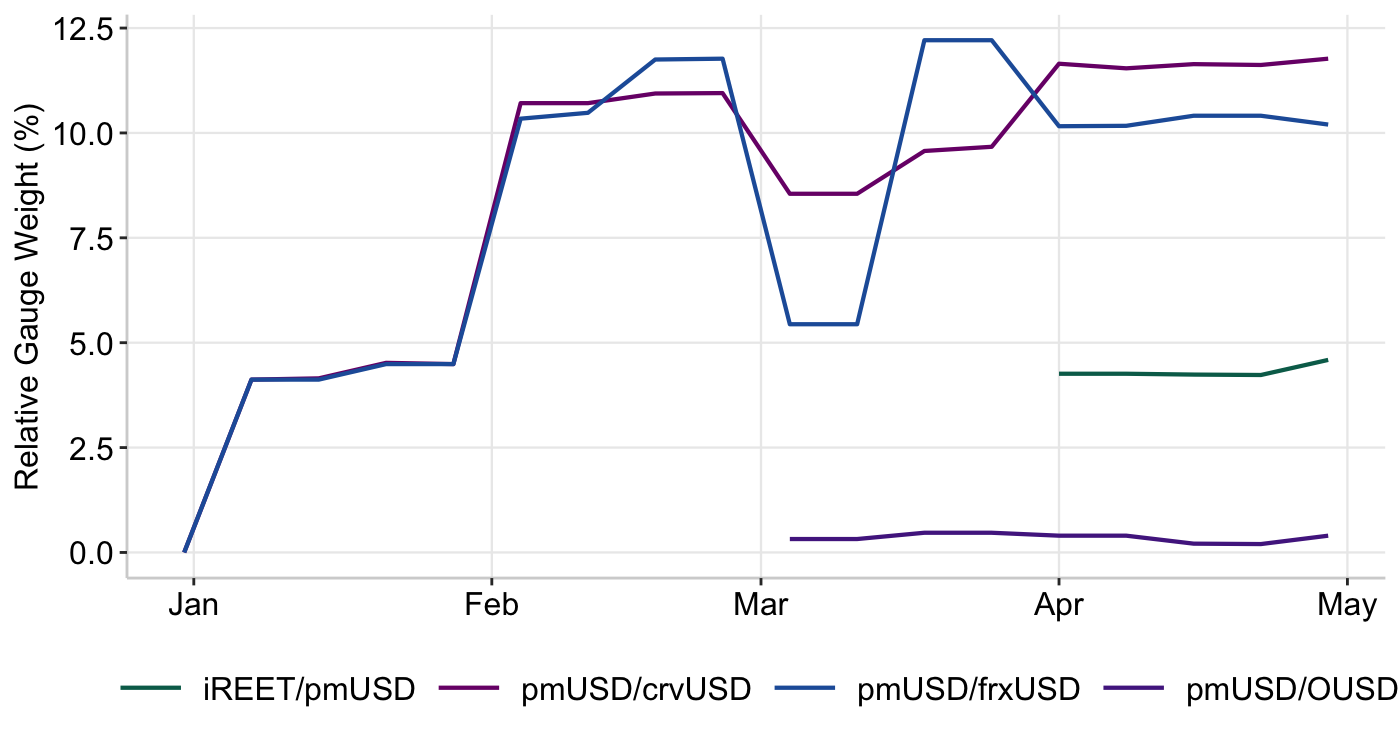
RAAC is built on the existing Curve Finance infrastructure and ecosystem, including active participation in the Curve Wars. Through this participation, RAAC has directed liquidity to its Curve pools. Graph 11 illustrates the relative gauge weight of RAAC’s liquidity pools within the Curve Finance ecosystem.
Graph 11: RAAC Curve Pools - Gauges
Source: curve.finance
RAAC’s substantial voting influence allows it to consistently direct emissions toward its own liquidity pools. During an April voting period, the pools generated a cumulative return of 32.62% on incentive at 0.22995 CRV price, showcasing the effectiveness of RAAC’s incentive strategy and the overall attractiveness of its pools.
pmUSD/crvUSD and pmUSD/frxUSD continue to receive the highest vote allocations relative to competing pools. pmUSD/crvUSD holds 11.77% of emission shares, while pmUSD/frxUSD holds 10.20%, with iREET/pmUSD and pmUSD/OUSD sitting at 4.6% and 0.04%, respectively. This creates a structural advantage by enabling RAAC to offer sustainable and predictable yields compared to competing pools.
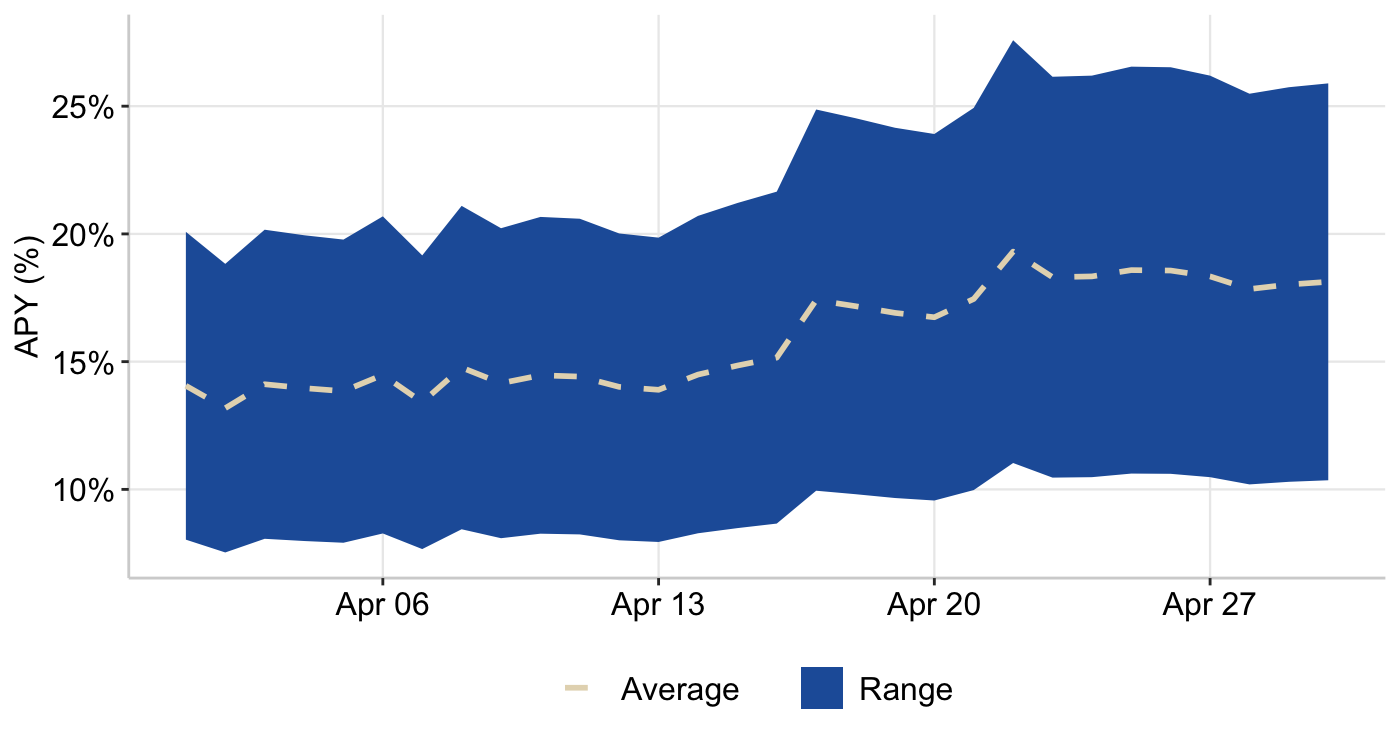
Figure 12: RAAC Curve Pools - Weighted Reward APY
Source: curve.finance
The weighted reward APY across RAAC’s Curve liquidity pools ranges from 7.5% to 27.5% and has trended higher over the past month. These are competitively high yields, supported by RAAC’s voting power. As a result, users can engage with RAAC products with greater long-term confidence, backed by both strong asset collateral and meaningful governance influence.
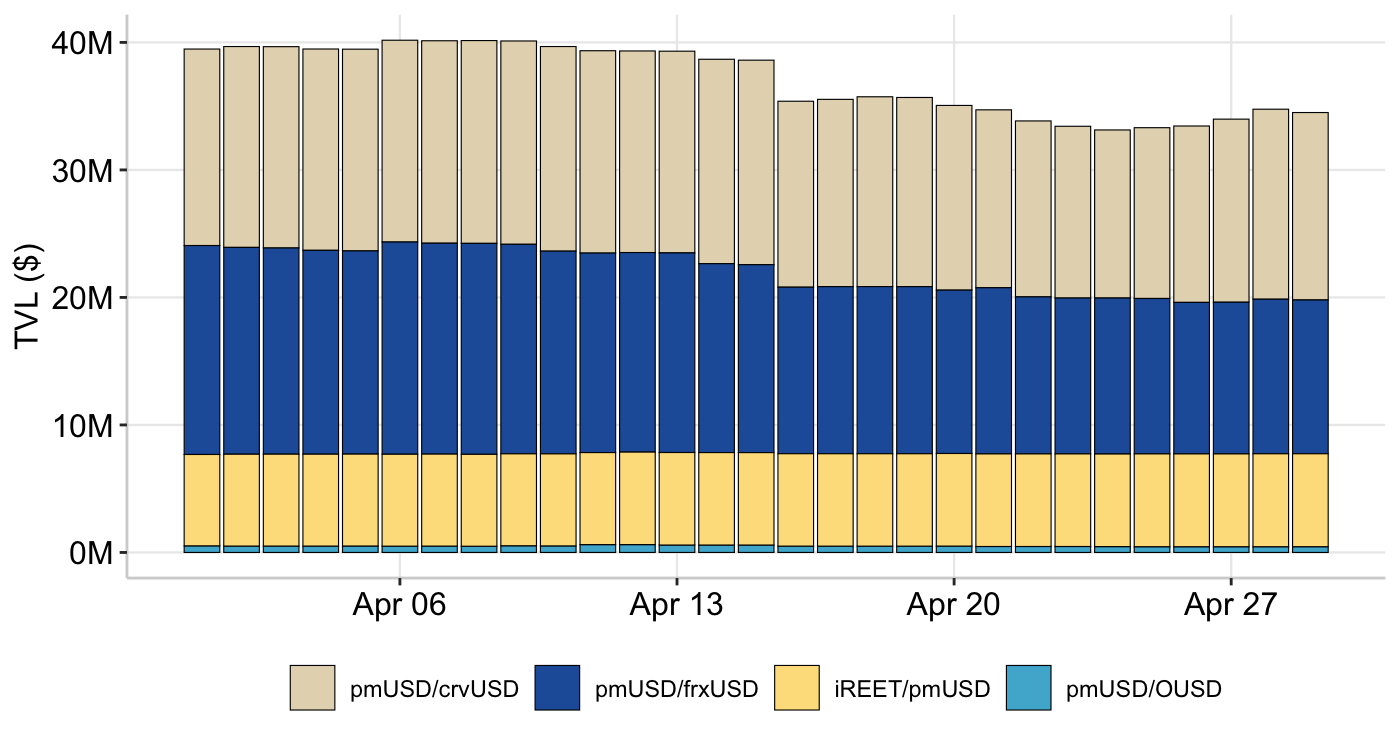
RAAC’s Curve Finance pools maintained a combined average total value locked (TVL) of $33–$39 million throughout April. The pmUSD/crvUSD pool continued to drive the majority of activity, while the newer iREET/pmUSD pool contributed an additional $7.2 million in liquidity. TVL declined during the month as RAAC removed $4 million in liquidity to actively manage the pmUSD peg, while the KelpDAO hack also weighed on broader DeFi risk sentiment. Nonetheless, RAAC’s pools continue to offer competitive yields and maintain strong liquidity across the ecosystem.
Graph 13: RAAC Curve Pools - Total Volume Locked (TVL)
Source: https://dune.com/4sh4/raac-pmusd
Participants can further enhance their yields by depositing LP tokens into protocols such as Stake DAO, Convex Finance, Beefy Finance, Yearn Finance, and Balancer to access boosted rewards. RAAC has also partnered with Royco Protocol and Euler Finance to further expand return opportunities for participants.
Resources
Data
https://tradingeconomics.com/indicators
https://fred.stlouisfed.org/series/DGS10
https://fred.stlouisfed.org/series/DGS5#
https://fred.stlouisfed.org/series/BAMLC0A0CM#
https://fred.stlouisfed.org/series/PRIME
https://fred.stlouisfed.org/series/MORTGAGE30US
https://app.koyfin.com/gyld
https://fred.stlouisfed.org/series/VIXCLS
https://defillama.com/stablecoins
https://www.coingecko.com
https://www.cboe.com/us/indices/dashboard/ovx-GVZ/
https://www.cboe.com/us/indices/dashboard/ovx/
https://www.convexfinance.com/
https://dune.com/4sh4/raac-pmusd
https://www.curve.finance/dao/ethereum/gauges
https://www.curve.finance/dex/ethereum/pools?search=pmusd
https://www.stakedao.org/yield?search=pmusd
https://curve.convexfinance.com/stake
https://app.beefy.com/
https://yearn.fi/vaults?type=lp&search=pmusd
https://app.morpho.org/ethereum/market/0x72cc79433e9f91c2a185422725510f4bdd19c9006010f464f851468b2371b756/srroyusdc-pmusd?tab=market#advanced
News
https://www.bloomberg.com/news/articles/2026-04-01/malta-fights-back-against-eu-s-crypto-regulation-plans
https://www.bloomberg.com/news/articles/2026-04-01/asian-stocks-to-rise-on-hopes-iran-war-nearing-end-markets-wrap
https://www.bloomberg.com/news/articles/2026-04-02/asian-equities-may-open-higher-after-us-rebound-markets-wrap
https://www.bloomberg.com/news/articles/2026-04-05/trading-open-shadowed-by-trump-escalation-threats-markets-wrap
https://www.bloomberg.com/news/articles/2026-04-07/bond-traders-risk-being-wrongfooted-by-2022-playbook-ubs-warns
https://www.bloomberg.com/news/articles/2026-04-06/stock-market-today-dow-s-p-live-updates
https://www.bloomberg.com/news/articles/2026-04-07/china-s-pboc-keeps-up-gold-buying-spree-as-iran-war-dents-prices
https://www.bloomberg.com/news/articles/2026-04-07/bitcoin-slides-with-risk-assets-as-trump-s-iran-ultimatum-looms
https://www.bloomberg.com/news/articles/2026-04-08/treasuries-rise-as-ceasefire-spurs-oil-drop-fed-rate-cut-hopes
https://www.bloomberg.com/news/articles/2026-04-08/stock-market-today-dow-s-p-live-updates
https://www.bloomberg.com/news/articles/2026-03-26/crypto-enters-the-mortgage-market-via-fannie-mae-eligible-loans
https://www.bloomberg.com/news/articles/2026-04-09/us-mortgage-rates-fall-for-first-time-since-iran-war-to-6-37
https://www.bloomberg.com/news/articles/2026-04-09/war-has-caused-lasting-damage-to-the-dollar-system-macroscope-mnrlrgh4
https://www.bloomberg.com/news/articles/2026-04-08/dollar-sinks-1-to-erase-this-year-s-gains-on-us-iran-ceasefire
https://www.bloomberg.com/news/articles/2026-04-15/us-homebuilder-sentiment-falls-to-seven-month-low-amid-iran-war
https://www.bloomberg.com/news/articles/2026-04-13/housing-shortage-is-at-least-10-million-homes-white-house-says
https://www.bloomberg.com/news/articles/2026-04-15/silver-market-poised-for-sixth-straight-annual-deficit-this-year
https://www.bloomberg.com/news/articles/2026-04-12/oil-surges-us-futures-drop-on-hormuz-blockade-markets-wrap
https://www.bloomberg.com/news/articles/2026-04-13/stock-market-today-dow-s-p-live-updates https://www.bloomberg.com/news/articles/2026-04-14/stock-market-today-dow-s-p-live-updates https://www.bloomberg.com/news/articles/2026-04-15/s-p-500-on-pace-for-record-close-as-ceasefire-rally-continues
https://www.bloomberg.com/news/articles/2026-04-15/hedge-funds-built-for-crypto-turn-to-oil-and-gold-on-24-7-venues
https://www.bloomberg.com/news/articles/2026-04-13/gold-steadies-as-traders-weigh-potential-to-revive-us-iran-talks
https://www.bloomberg.com/news/articles/2026-04-16/stock-market-today-dow-s-p-live-updates
https://www.bloomberg.com/news/articles/2026-04-16/bitcoin-s-fragile-recovery-sets-up-a-big-short-squeeze-risk
https://www.bloomberg.com/news/articles/2026-04-20/strategy-buys-2-54-billion-of-bitcoin-most-since-november-2024
https://www.bloomberg.com/news/articles/2026-04-20/-stock-market-today-dow-s-p-live-updates
https://www.bloomberg.com/news/articles/2026-04-21/stock-market-today-dow-s-p-live-updates
https://www.bloomberg.com/news/articles/2026-04-22/stock-market-today-dow-s-p-live-updates
https://www.coindesk.com/business/2026/04/23/aave-rallies-defi-partners-to-contain-fallout-from-usd292-million-kelpdao-hack
https://www.bloomberg.com/news/articles/2026-04-25/bitcoin-s-stealth-rally-has-traders-setting-sights-on-80-000
https://www.bloomberg.com/news/articles/2026-04-27/strategy-slows-bitcoin-buying-switches-back-to-common-sales
https://www.coindesk.com/business/2026/04/27/cross-border-b2b-stablecoin-payments-to-rise-by-over-37-000-to-usd5t-by-2035
https://www.bloomberg.com/news/articles/2026-04-27/defi-rescue-hurts-anti-wall-street-pitch-after-10-billion-run
https://www.bloomberg.com/news/articles/2026-04-28/yen-gains-against-dollar-after-boj-keeps-interest-rates-on-hold https://www.bloomberg.com/news/articles/2026-04-21/euro-attracts-bullish-options-buyers-as-currency-goes-off-script https://www.bloomberg.com/news/articles/2026-04-27/deutsche-jpmorgan-favor-energy-linked-currencies-amid-iran-war
https://www.bloomberg.com/news/articles/2026-04-28/private-credit-s-rude-awakening-gives-bond-funds-a-new-edge
https://www.bloomberg.com/news/articles/2026-04-23/mortgage-rates-in-us-fall-for-third-week-dropping-to-6-23
https://www.bloomberg.com/news/articles/2026-04-26/us-stock-futures-decline-as-iran-talks-stall-markets-wrap
https://www.bloomberg.com/news/articles/2026-04-30/us-gdp-rose-2-in-early-2026-in-sign-of-economy-s-resilience?srnd=homepage-canada
https://www.bloomberg.com/news/articles/2026-04-28/asian-stocks-set-for-muted-open-after-us-selloff-markets-wrap