
Overview
Macroeconomic & Traditional Finance Outlook
Inflation growth slowed and unemployment fell this month, though labor-force participation also declined. Treasury yields are elevated amid a broader global bond selloff, causing the US Treasury to roll out new buybacks and a “twist” to cool long term yields. The Yen depreciated, prompting joint intervention from Japan and the US, causing the dollar to weaken. US equities reached new records this month, with the S&P 500 and Dow Jones closing at all-time highs.
Real-World Assets (RWA) Outlook
US home sales declined further as elevated rates continue to weigh on affordability. Oil prices fluctuated on Strait of Hormuz negotiations, easing as talks progressed before rebounding as hopes for a resolution faded, with global supply still constrained despite the volatility. Gold extended its rally to a 10-week high as debasement trade was revived.
Decentralized Finance (DeFi) Outlook
Bitcoin surged this month on large inflows into BTC ETFs, with the rally extending across much of the crypto market. Wall Street's push into tokenization remains small in scale but is expanding quickly. Regulatory attention turns to the Clarity Act and global finance ministers' talks on a coordinated crypto and stablecoin framework.
RAAC Outlook
The iREET/pmUSD pool continued to lead the ecosystem on yield, offering the most competitive returns across RAAC's Curve pools. Pool TVL slipped toward month-end, however, as pmUSD price depreciation prompted some liquidity withdrawals.
Macroeconomic & Traditional Finance Outlook
United States
The federal funds rate remained unchanged at 3.50%–3.75%, as no Federal Open Market Committee (FOMC) meeting was held this month. Core CPI rose 0.2% MoM and 2.5% YoY, marking its slowest annual pace since March 2021, while PPI was unchanged on a MoM basis. The unemployment rate fell to 4.1%, although this was accompanied by weaker labour-force participation. Meanwhile, the US trade deficit increased 17.2% MoM to $118.8B, its largest level since March 2025.
Recent weakness in employment and softer inflation have reduced expectations for further monetary tightening, giving the Fed more room to remain patient. However, Fed Chair Kevin Warsh delivered a hawkish message at the Jackson Hole Economic Symposium, with markets pricing roughly a 50% probability of a September rate hike and at least one hike by year-end.
Table 1: U.S. Economic Indicators
| Indicator | Period | Actual | Previous | Consensus |
|---|---|---|---|---|
| GDP | Q2 | 1.5% | 2.1% | 1.5% |
| Unemployment | July | 4.1% | 4.2% | 4.2% |
| Core CPI (YoY) | July | 2.5% | 2.6% | 2.5% |
| 1YR Inflation Expectations | Aug | 4.0% | 4.2% | 4.3% |
Source: tradingeconomics
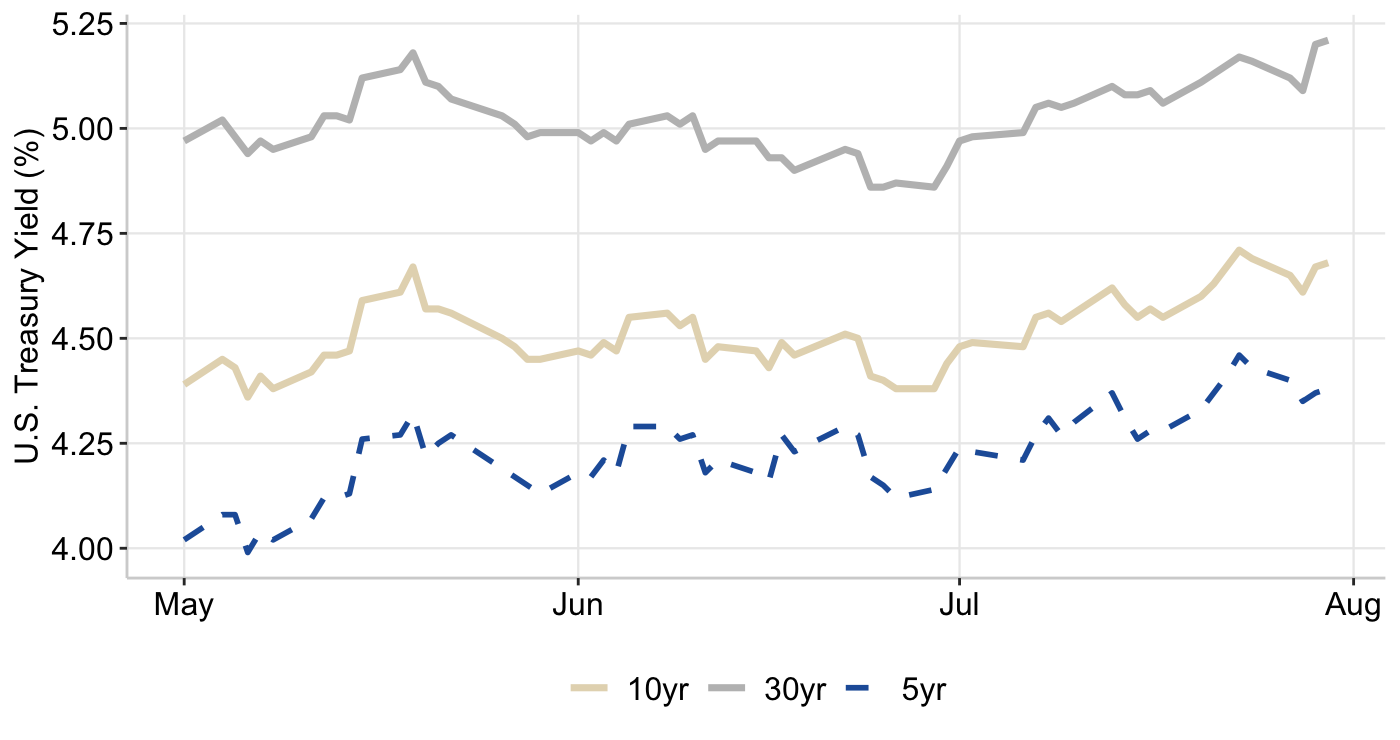
Treasury yields remain historically elevated with the 30-year yield rising to 5.31%, its highest level since 2007, and the 10-year yield climbing to 4.75%, its highest level in 19 months. The move reflects a broader global bond selloff, as markets are pricing higher interest rates across Japan, Canada, Europe, and the UK, creating pressure on bond markets worldwide. Markets are pricing roughly 400 bps of rate hikes across seven major economies over the next year, which could further tighten financial conditions and place pressure on highly valued equities. This global shift toward higher-for-longer rates is being driven by persistent inflation, increased fiscal spending, elevated energy costs, and AI-led economic growth.
Graph 1: U.S. 5-Year, 10-Year, & 30-Year Treasury Yields
Source: FRED
The massive borrowing required to finance AI infrastructure is also competing with US Treasuries for investor demand. Bank of America estimates that the surge in corporate debt issuance, combined with increased mortgage-backed securities supply, has pushed the 10-year Treasury yield roughly 0.3 percentage points higher this year.
The US Treasury also announced plans to double its buyback of long-dated Treasuries. It had previously planned up to $14 billion of 10–30 year Treasury buybacks between September and November, while the new announcement implies at least $28B of additional demand for long-term bonds. Furthermore, Bessent announced that the Treasury would implement a “Twist,” replacing longer-term debt issuance with shorter-term Treasury bills. While the announcement initially pushed yields lower, the decline lasted only a day, as investors largely viewed the measures as a “Band-Aid” rather than a solution to the underlying problems in the bond market. The core issue remains the scale of US government debt, which has now surpassed $40 trillion.
Credit spreads averaged 0.80% this month, remaining at historically low levels. Borrowing to finance AI infrastructure is adding significant supply to credit markets, with investment-grade companies issuing nearly $1.5 trillion in bonds in 2026, up 36% year-over-year and on pace to surpass the previous record set in 2020. Nvidia, in particular, has secured more than $500 billion in financing commitments from major investment firms to support the continued expansion of AI infrastructure.
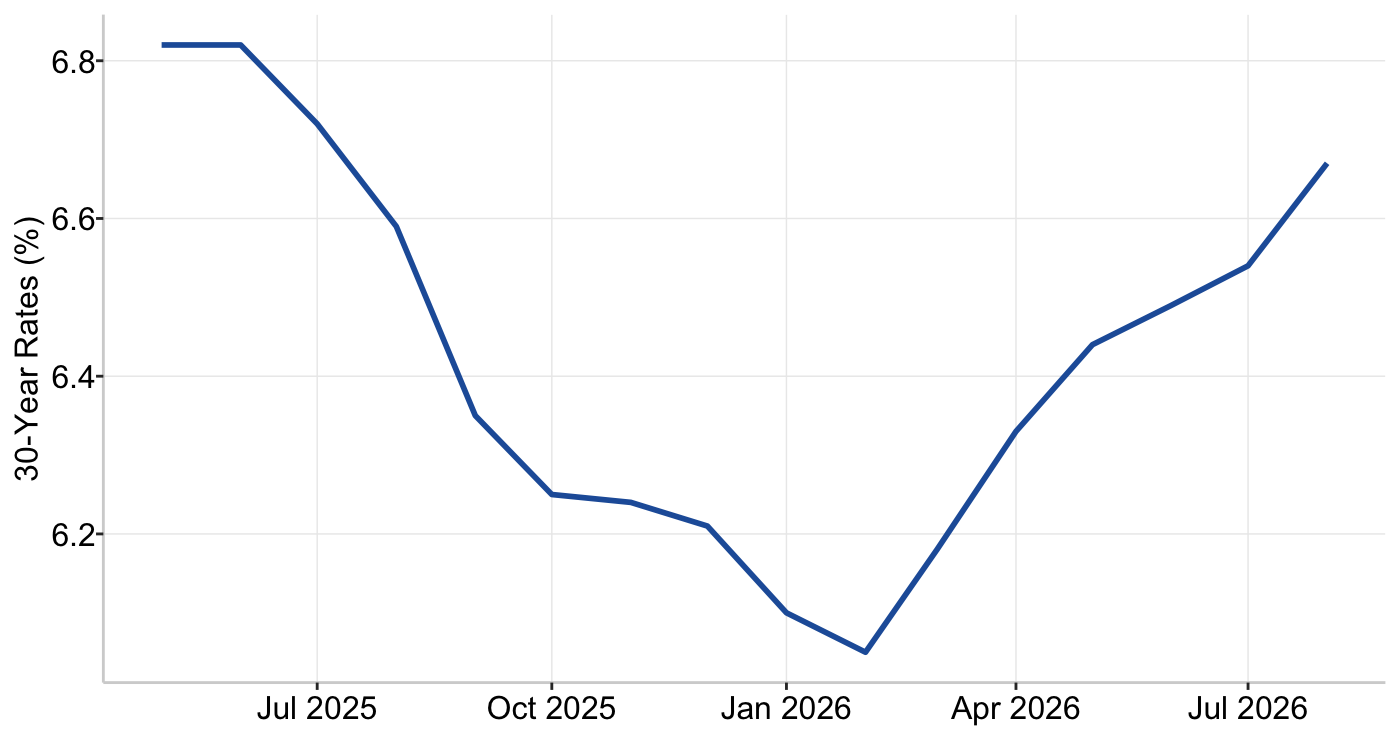
Graph 2: US 30-Year Mortgage Rates
Source: FRED
US average 30-year fixed mortgage rates rose to 6.69% at the beginning of the month before declining consecutively and then rising to 6.66% at month-end. Mortgage rates remain at their highest levels in a year, as elevated long-term Treasury yields continue to keep borrowing costs high and affordability under pressure.
World Currencies
The US dollar weakened this month, reaching its lowest level since May following the announcement of Treasury buybacks. Lower Treasury yields reduce the attractiveness of dollar-denominated debt and could place further downward pressure on the US dollar as de-dollarization concerns persist. Analysts believe that if the intervention fails to push Treasury yields toward 5%, it could further accelerate the dollar’s decline. Dollar positioning has also turned bearish, with traders unwinding long-dollar positions while one-month options have shifted against the dollar for the first time since February. Investors are looking toward gold, the euro, Swiss franc, Asian currencies, and the yen as alternatives to USD exposure.
Japan and the US have intervened heavily to support the yen, with Japan spending an estimated $53B on July 30 and another $34B on July 31, following nearly $74B in intervention in April. The yen had fallen to around ¥164 per US dollar, its weakest level since 1986, as Japan’s interest rates remain significantly below US rates, encouraging investors to borrow cheaply in yen and invest in higher-yielding assets abroad. The US has indicated a willingness to continue intervening alongside Japan to support the yen, describing the cooperation as a “signal of friendship” between the two countries. However, intervention alone is unlikely to reverse the yen’s weakness while large interest-rate differentials, high Japanese debt, energy dependence, and strong demand for dollar assets remain.
Table 2: World Currencies Performance (Month-to-Date)
| USD | EUR | GBP | JPY | CAD | |
|---|---|---|---|---|---|
| USD | -0.5% | -0.3% | 1.5% | -1.0% | |
| EUR | 0.5% | 0.1% | 1.9% | -0.5% | |
| GBP | 0.3% | -0.1% | 1.8% | -0.7% | |
| JPY | -1.5% | -1.9% | -1.8% | -2.4% | |
| CAD | 1.0% | 0.5% | 0.7% | 2.5% |
Source: Koyfin
Japan-US intervention to strengthen the yen is also putting additional appreciation pressure on the Chinese yuan, as yen gains spill over into other Asian currencies. The yen has since given back roughly half of its gains following the first coordinated US-Japan intervention on July 31, although currencies such as the South Korean won, Singapore dollar, and Taiwan dollar remain relatively strong.
The yuan is up approximately 3.6% against the US dollar this year, making it Asia’s best-performing currency despite continued weakness across parts of China’s domestic economy. China is facing a “dual-track” economy, characterized by a strong yuan and resilient export sector alongside weak domestic demand and declining bond yields.
Dollar-funded emerging-market carry trades have delivered positive returns for seven consecutive quarters, marking their longest winning streak since 2008. High-yielding emerging-market currencies have continued to perform strongly, including the Colombian peso, Turkish lira, Brazilian real, Mexican peso, and South African rand.
Equities
This month, US stocks reached record highs, supported by easing geopolitical risks, temporary relief in financial conditions, and strong corporate earnings that reignited the rally in AI stocks. The S&P 500 and Dow Jones closed at all-time highs at $7799 and $54,349, respectively. The Nasdaq 100 peaked at $30,085, while semiconductor companies posted their strongest four-day rally since 2020.
Optimism surrounding a potential US-Iran agreement to reopen the Strait of Hormuz helped ease inflation concerns, while cooling inflation further boosted risk appetite. US stocks also gained modestly as investors welcomed the Treasury’s decision to support lower long-term yields.
US corporate earnings remain exceptionally strong, with S&P 500 profit growth running above 30% in Q2, making it one of the strongest earnings periods in recent history. Analysts expect earnings growth to fall below 20% by Q1 2027 and slow toward the mid-teens throughout 2027. Companies continue to exceed expectations, with 85.2% of S&P 500 companies beating Wall Street EPS estimates, the highest share since 2021, while only 10.8% have missed estimates, the lowest rate in roughly three decades. However, peak earnings risk remains, and a continued economic upturn could reignite inflationary pressures and push interest rates higher.
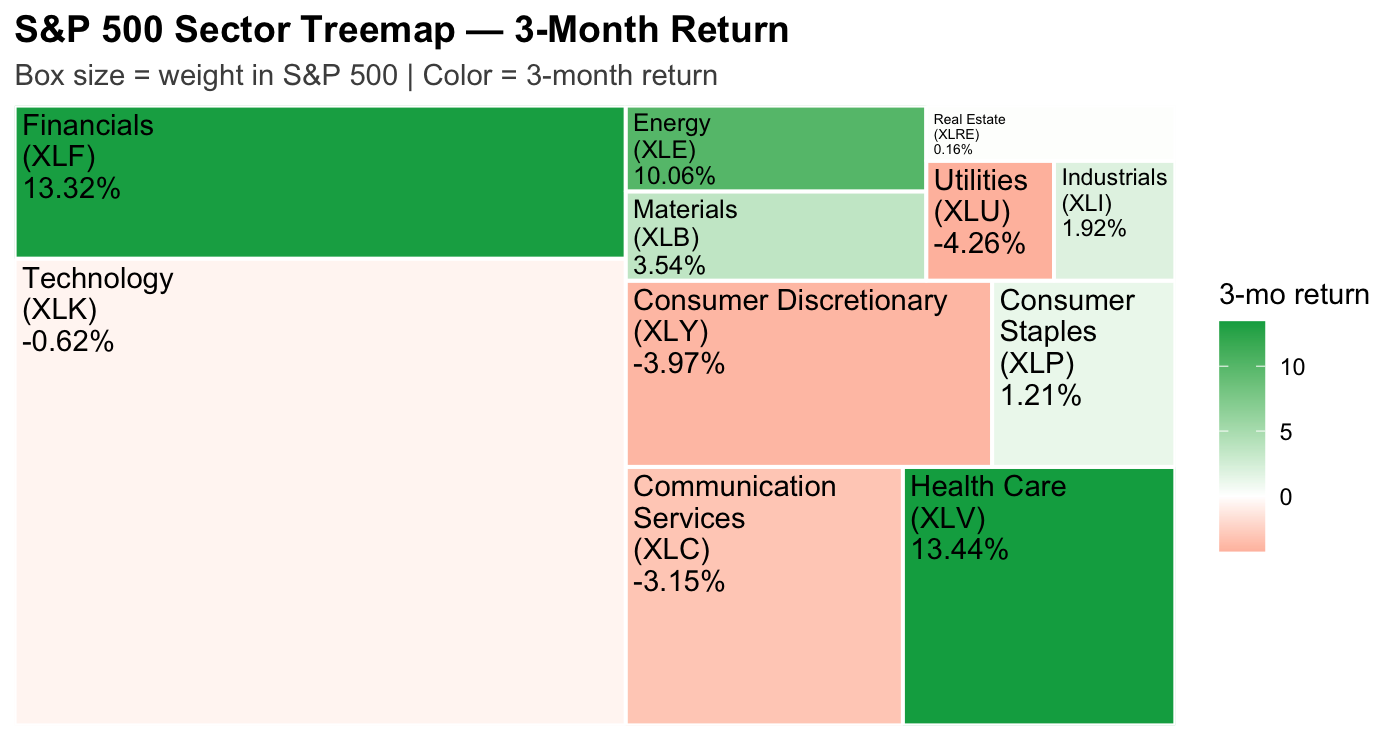
Graph 3: S&P 500 Sectors – 3 Month Snapshot
Source: State Street SPDR
Tech stocks rebounded ahead of Nvidia’s earnings, ending its seven-session losing streak. Nvidia expects 70% revenue growth next fiscal year, above analysts’ 45% forecast, reinforcing that AI spending remains exceptionally strong. While the market remains bullish on AI, investors are becoming cautious about elevated valuations and the sector’s reliance on continued earnings growth and capital investment. Investors are no longer buying AI-related companies indiscriminately; instead, performance is becoming company-specific.
AI backlash is also emerging as an investment risk, with Wall Street incorporating growing political and public opposition to AI and data-center expansion into equity recommendations. Data centres are becoming a bipartisan political issue, as voters raise concerns over their environmental impact and rising electricity costs. AI-related leveraged ETFs have also created a concentrated source of mechanical buying and selling pressure across a relatively small group of stocks. This can amplify volatility in AI equities even though these ETFs remain relatively small compared with the broader equity market.
Real-World Assets (RWA) Outlook
RAAC backs its products with real-world assets (RWAs), providing greater stability. The following section reviews the current market performance of each underlying and future asset.
Real Estate Environment
US home sales fell 4.1% in July, reaching their lowest level in nearly two years as affordability remains the central constraint. Mortgage rates remain elevated, while US home prices have increased 3.4% from a year earlier. Americans now need nearly $110,000 in annual income to afford an average US home, while average asking rents rose to nearly $2,000 in July.
There are now almost 500,000 more sellers than buyers, with sellers reducing prices on 20% of active listings. While this provides buyers with some negotiating power, elevated financing costs continue to disproportionately constrain lower-income and first-time buyers, with starter-home sales falling 5.4% YoY in May. Higher-income buyers, however, remain comparatively resilient, with luxury-home sales increasing 6.2%.
Commodities overview
Brent crude fell below $80/barrel, while West Texas Intermediate (WTI) declined to $75.8/barrel this month as the US and Iran moved closer to an agreement to reopen the Strait of Hormuz. Despite the improvement in market sentiment, global oil supply remains constrained, with flows through the Strait still well below pre-war levels. Markets are pricing in a more favourable outlook, although this optimism remains dependent on diplomatic progress, particularly as hopes for a US-Iran peace agreement have weakened following Bessent’s plans to economically isolate Iran and pressure countries continuing to do business with it.
The International Energy Agency (IEA) expects a significantly larger global oil supply deficit in Q3 2026, forecasting a shortfall of 1.8 million barrels per day (bpd). Despite the supply shock, global oil demand is also weakening as elevated prices weigh on consumption. The IEA cut its 2026 demand outlook by nearly 50%, now expecting demand to decline by 1.6 million bpd—the largest annual decline since the COVID-19 pandemic. The market is expected to shift back into a surplus in 2027, with global supply potentially exceeding demand by 4.6 million bpd. Countries including the US, Japan, and Germany will also need to replenish emergency oil reserves after releasing a record amount of stockpiles in March to cushion the initial supply shock. China is helping offset the demand shock through continued expansion of its electric-vehicle fleet, which displaced more than 1.5 million bpd of oil consumption during Q2 and reduced its reliance on imported crude.
Gold also remained strong in August, advancing more than 14%, with spot gold rising above $4,600/oz. Gold reached a 10-week high and was heading toward its strongest weekly performance since late January before experiencing some profit-taking. Gold has decisively recovered above the $4,000/oz technical level in recent weeks, supported by renewed investor demand from dip-buyers and increased central-bank purchases. Chinese gold-backed ETFs recorded 14 consecutive days of inflows, their longest streak since March, while China’s central bank added 20 tonnes of gold to its reserves in July.
Furthermore, the Treasury’s planned intervention could provide another catalyst for gold, with the announcement pushing gold prices toward their 200-day moving average due to renewed interest in the debasement trade.
However, gold sold off sharply after Fed Chair Kevin Warsh delivered a more hawkish message on inflation and interest rates. Higher rates strengthen the dollar and increase the opportunity cost of holding gold, creating additional downward pressure on prices. Gold is expected to give back some of its recent gains, potentially moving toward the lower end of its recent $4,200–$4,700 range by year-end.
Graph 4: Monthly Return on Gold
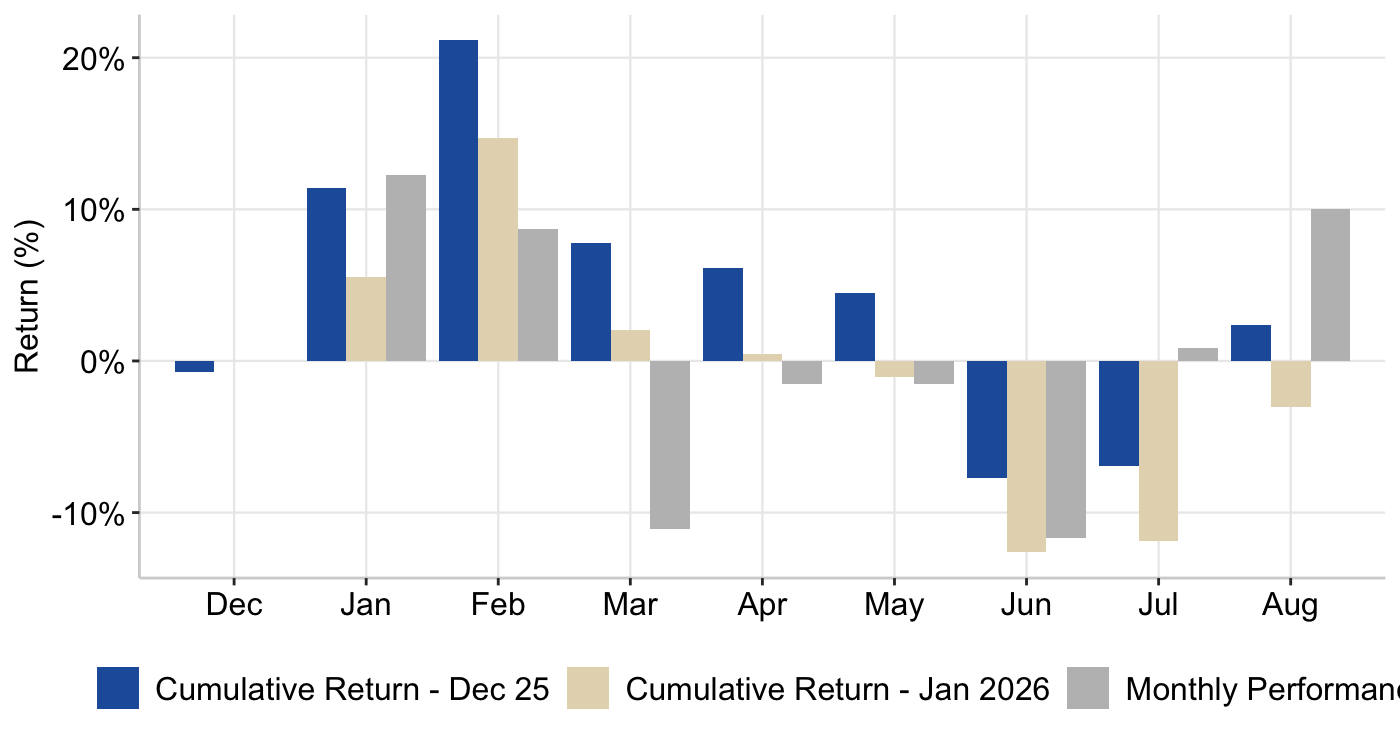
The graph above showcases monthly gold returns since the start of the year with three scenarios. The first is standalone gold monthly returns followed by cumulative returns with starting points in December 17, 2025 and January 13, 2026, the dates that pmUSD was minted. While both cohorts experienced the same subsequent market environment, the December cohort maintained a roughly 5.2-percentage-point advantage over the January cohort by August. The divergence between the two cumulative-return series demonstrates that pmUSD's timing of minting is important given its exposure to gold prices that will affect the collateral health.
Decentralized Finance (DeFi) Outlook
Cryptocurrencies
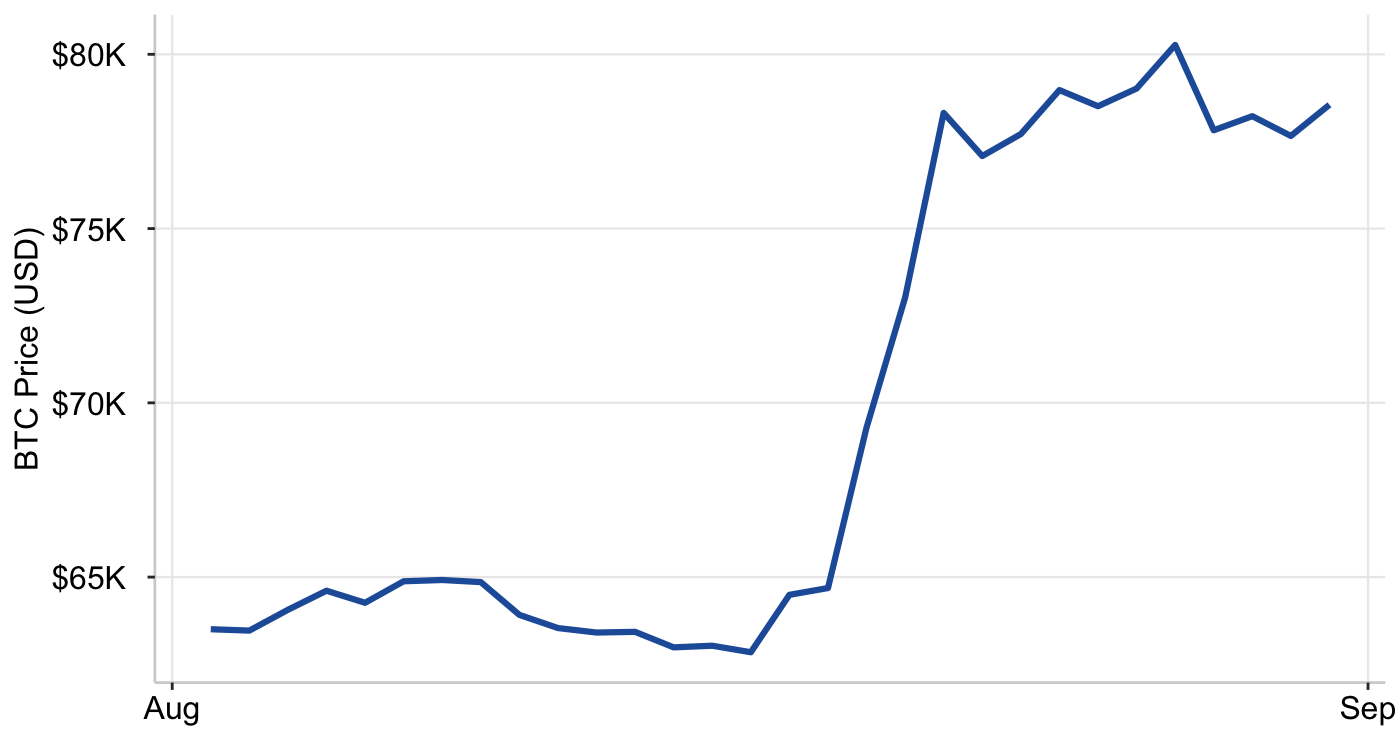
Bitcoin (BTC) reached $81,257, its highest level since mid-May, as it broke out of its months-long trading range. Lower US Treasury yields were a major catalyst, while Trump’s meeting with major crypto executives also helped revive optimism surrounding the Clarity Act.
The Clarity Act is a major crypto market-structure bill that has stalled in the Senate amid partisan disagreements. Regulatory uncertainty remains a key risk, as industry leaders want to preserve recent regulatory progress through legislation rather than relying solely on executive or agency actions. A cloture motion vote is scheduled for September 15, with 60 votes required to advance the legislation to the next stage.
Moreover, renewed interest in the debasement trade has revived the narrative of Bitcoin as a potential hedge against fiscal deterioration, dollar weakness, and rising government debt. BTC gained 24% over seven days, marking its strongest weekly increase in three years, including a 7.7% surge on August 19. Approximately $7.2 billion in leveraged bearish crypto positions were liquidated, while more than $3 billion in crypto shorts were liquidated over a 24-hour period.
US-listed Bitcoin ETFs attracted more than $850 million in inflows, their strongest weekly inflows since April, following the Coldcard hack that shifted attention toward regulated spot ETFs and away from self-custody. Hackers stole approximately $130 million in Bitcoin by exploiting a flaw in the software of Coldcard hardware wallets. The number of crypto thefts this year has surpassed 207, the highest recorded for any six-month period, with approximately $972 million stolen. However, this remains below the $2.3 billion stolen during the first half of 2025.
Institutional participation is making Bitcoin’s bear markets less volatile than previous crypto downturns, as investors increasingly use ETFs, derivatives, and structured products rather than purchasing cryptocurrencies directly. Compared with previous years, regulation has also become more defined across several major jurisdictions, reducing legal uncertainty and making institutional participation easier.
Graph 5: BTC/USD
Source: coingecko
Ethereum (ETH) is outperforming BTC, gaining 31.5% over seven days. ETH moved above $2,300 and briefly approached $2,400, following a roughly 25% gain over two days as US spot Ethereum ETFs recorded approximately $221M in net inflows on August 20, extending their inflow streak to four consecutive days, with BlackRock leading the buying. Prediction markets reportedly assigned a 64% probability of ETH reaching $3,000 before falling to $1,500, marking a significant reversal from previously bearish positioning.
Wall Street is continuing to explore tokenization, with tokenized traditional assets nearly doubling over the past year to $37 billion. While tokenization remains small relative to global securities markets, the sector is growing rapidly, reflecting the continued mainstreaming and institutionalization of crypto. Robinhood is also launching cryptocurrency trading in the UK, allowing customers to trade more than 50 cryptocurrencies directly through the Robinhood app.
Moreover, crypto is creating 24/7 markets for traditional assets. Trade.xyz, launched in October 2025, has generated $500 billion in trading volume by offering perpetual futures tied to oil, gold, stock indexes, and pre-IPO companies. During the US-Iran conflict, traditional oil markets were closed over the weekend, while Trade.xyz’s blockchain-based oil contracts continued trading, providing investors with a live indication of how markets were pricing the conflict.
Stablecoins
Stablecoins are cryptocurrencies that are commonly held because they offer lower volatility than Bitcoin and Ethereum, allowing users to preserve capital while remaining active on-chain. RAAC issues its own stablecoin, Precious-Metal USD (pmUSD), which operates on the Ethereum blockchain.
The total stablecoin market capitalization has reached $304 billion, but has plateaued in 2026 following several years of rapid growth. However, analysts believe stablecoin circulation could grow to $1.45 trillion by 2035. US dollar-pegged stablecoins, Tether (USDT) and USD Coin (USDC), remain the dominant assets within the ecosystem, accounting for ~84% of the market, as dollar-backed stablecoins continue to serve as the global standard. Beyond the US dollar, euro-denominated stablecoins remain a very small portion of the overall market. Circle’s regulated euro-denominated stablecoin, EURC, has a market capitalization of $455 million, while the tokenized British pound, tGBP, has a market capitalization of $27 million.
The Ethereum network hosts approximately $147 billion in stablecoin supply, representing roughly 48% of the global market, and continues to serve as the leading blockchain for stablecoin issuance and activity. The following table compares the market capitalizations of major stablecoins alongside the currencies currently paired with pmUSD.
Table 3: 1 Month Market Capitalization
| Stablecoin | Position | Market Capitalization |
|---|---|---|
 pmUSD pmUSD |
70 | $48.05M |
 USDT USDT |
1 | $183.305B |
 USDC USDC |
2 | $73.552B |
 PYUSD PYUSD |
8 | $2.88B |
 crvUSD crvUSD |
30 | $283.48M |
 frxUSD frxUSD |
49 | $108.84M |
 fxUSD fxUSD |
54 | $78.61M |
| Source: DefiLlama |
Stablecoin regulation is drawing attention, with G20 finance ministers and central bankers scheduled to meet in December to discuss global frameworks for stablecoins, including mutual recognition, common rules of use, and cross-border economic fungibility. A successful outcome could create a pathway toward simpler and more efficient cross-border payments.
Hyperliquid gained significant attention this month after President Trump expressed support for the project and stated that CFTC Chair Mike Selig is working to bring Hyperliquid into the US in a fully compliant and legal manner. Revolut is also launching its own euro-backed stablecoin, EURR, marking its entry into the growing institutional stablecoin market. Customers will be able to move between traditional euros and crypto on-chain through the Revolut app, reducing friction between fiat and digital assets. The initial rollout will take place in Denmark, Poland, and Portugal, further highlighting the integration of stablecoins into mainstream financial infrastructure.
Tether also completed its first full independent financial audit, with KPMG US issuing an “unqualified audit opinion” on Tether International’s 2025 financial statements. KPMG found that the statements fairly represented Tether’s financial position under US GAAP. The audit strengthens confidence in USDT given Tether’s dominant position as the world’s largest stablecoin issuer and provides RAAC and pmUSD with a potential pathway toward greater transparency and institutional credibility.
RAAC Outlook
RAAC has two live products: Precious-Metal USD (pmUSD) and the Index Real Estate Token ($iREET). The following section reviews the characteristics of these products and focuses on the liquidity pools through which they generate yield.
Precious-Metal USD (pmUSD)
Precious-Metal USD (pmUSD) is RAAC’s stablecoin, backed by tokenized in-situ gold worth $121.98M provided by I-ON Corporation. This gives investors on-chain exposure to a gold-backed digital asset that can also be used to generate yield.
pmUSD currently has a market capitalization of $49.5M and remains depegged from its $1.00 target. pmUSD averaged $0.5464 throughout August, while increasing 12% over the past 30 days. RAAC continues to actively monitor the situation and remains committed to implementing the $8M redemption facility, providing holders with a clear pathway to redeem pmUSD for physical gold-related value through recognized partners.
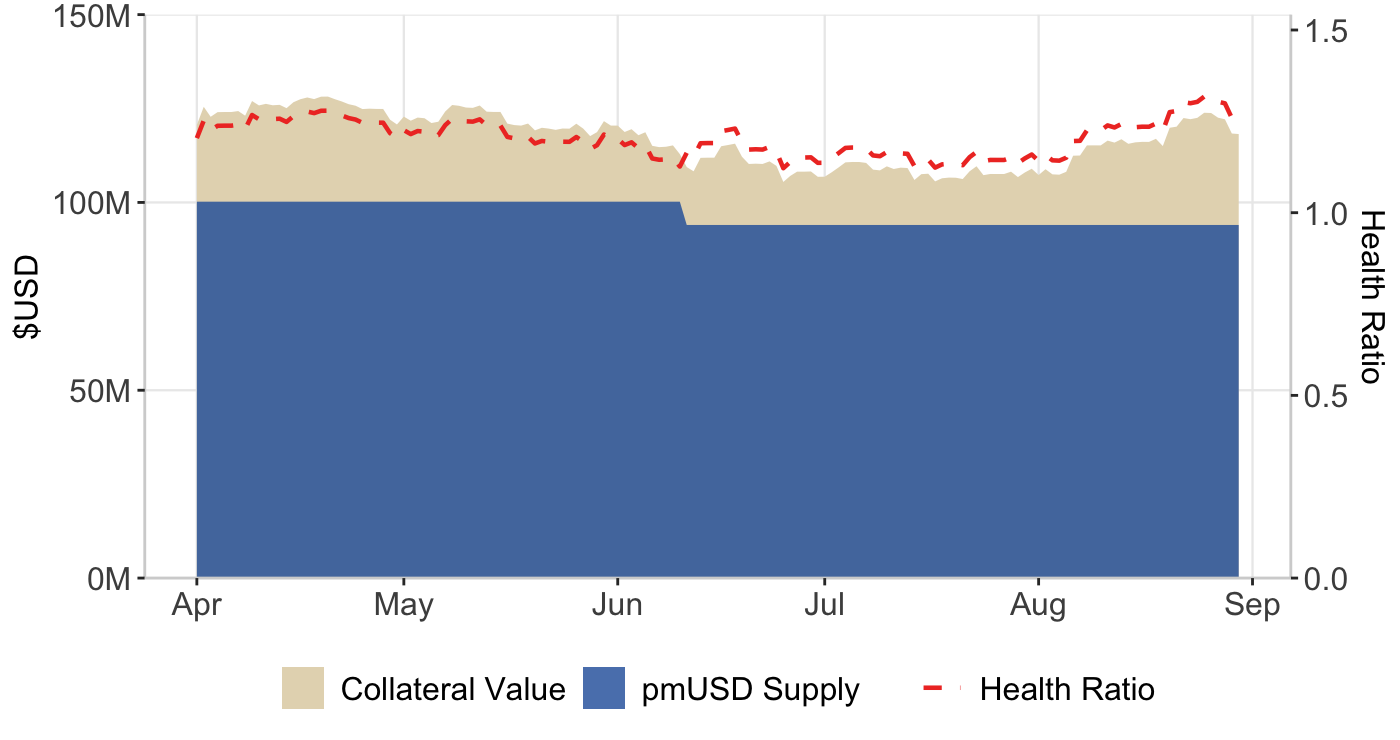
Table 6: Collateral vs pmUSD supply
Source: https://dune.com/4sh4/raac-pmusd
The collateral value averaged $116M, increasing 8.4% over the past month as gold prices appreciated. Meanwhile, pmUSD supply averaged approximately $94M, resulting in an average overcollateralization ratio of 1.23x, with RAAC maintaining a relatively stable health ratio.
$iREET
The Index Real Estate Token ($iREET) is a tokenized real estate index that provides users with exposure to a diversified portfolio of properties through a single token. By depositing a REET NFT into the index, users receive $iREET tokens representing a proportional share of the index’s net asset value (NAV).
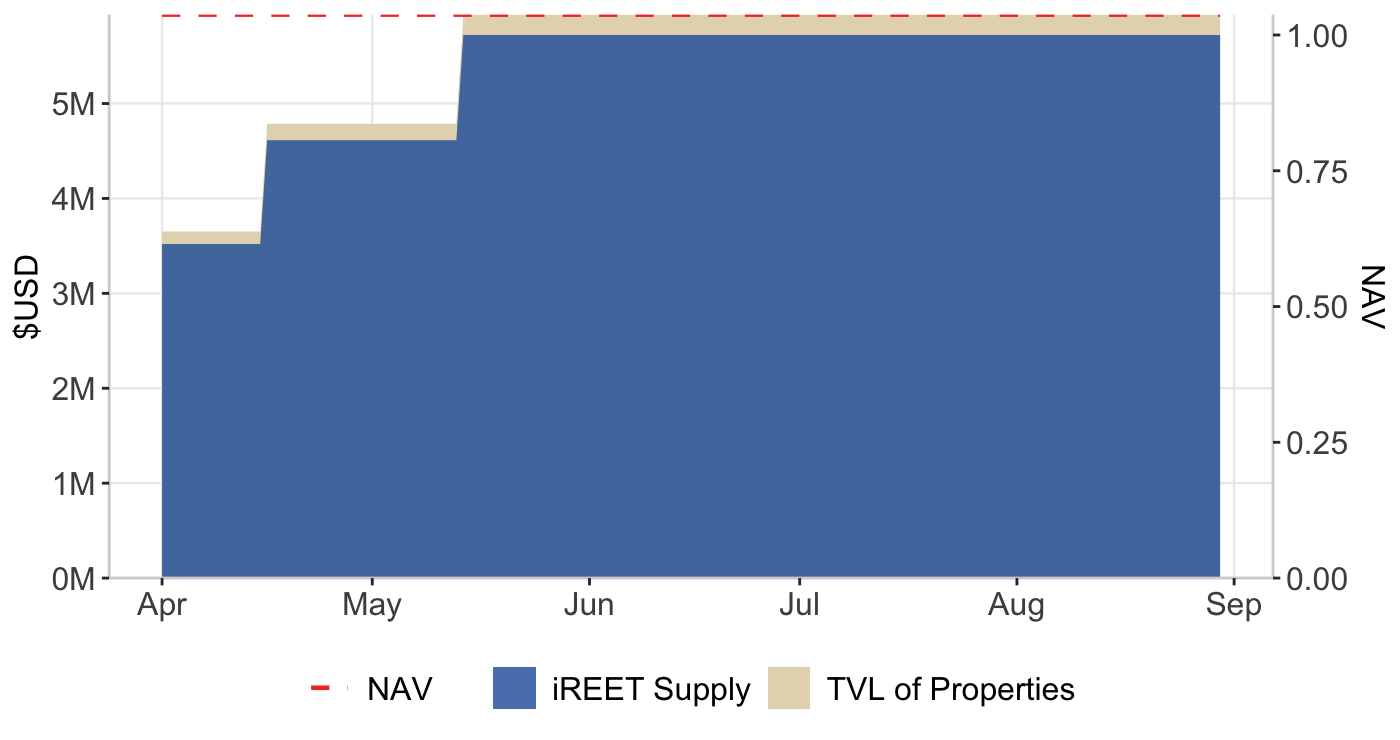
The iREET vault currently holds 17 tokenized properties with a combined value of $5.94M, supporting a circulating supply of 5.72M iREET tokens. The net asset value (NAV) per iREET is $1.0375, below the current market price of $1.1153.
The 17 tokenized properties, which RAAC directly acquired, are primarily part of the Section 8 housing market in the US. The properties generate ~$42.7K in monthly rental income, which flows back into and further strengthens RAAC’s lending ecosystem.
Graph 7: NAV per $iREET
Source: Dune
Notes: NAV per $iREET = TVL / Circulating Supply
Glimpse into the Curve Wars
RAAC is built directly within Curve Finance and actively participates in the Curve Wars, the ongoing competition to control governance power within the protocol. By locking CRV tokens, participants receive vote-escrowed CRV (veCRV), which grants voting rights to determine which liquidity pools receive reward emissions, ultimately shaping yield levels and liquidity depth. Protocols such as Convex Finance and Stake DAO have accumulated significant veCRV positions and, through their own tokens, offer alternative pathways to access Curve governance power.
The Kingmaker Ratio is a RAAC-specific metric used to evaluate whether acquiring veCRV directly or accumulating voting power through another protocol is the most efficient strategy per dollar. The metric is defined as:
$Kingmaker\ Ratio\ =\ \frac{veCRV/$\ via\ protocol\ i}{veCRV/$\ via\ CRV}$
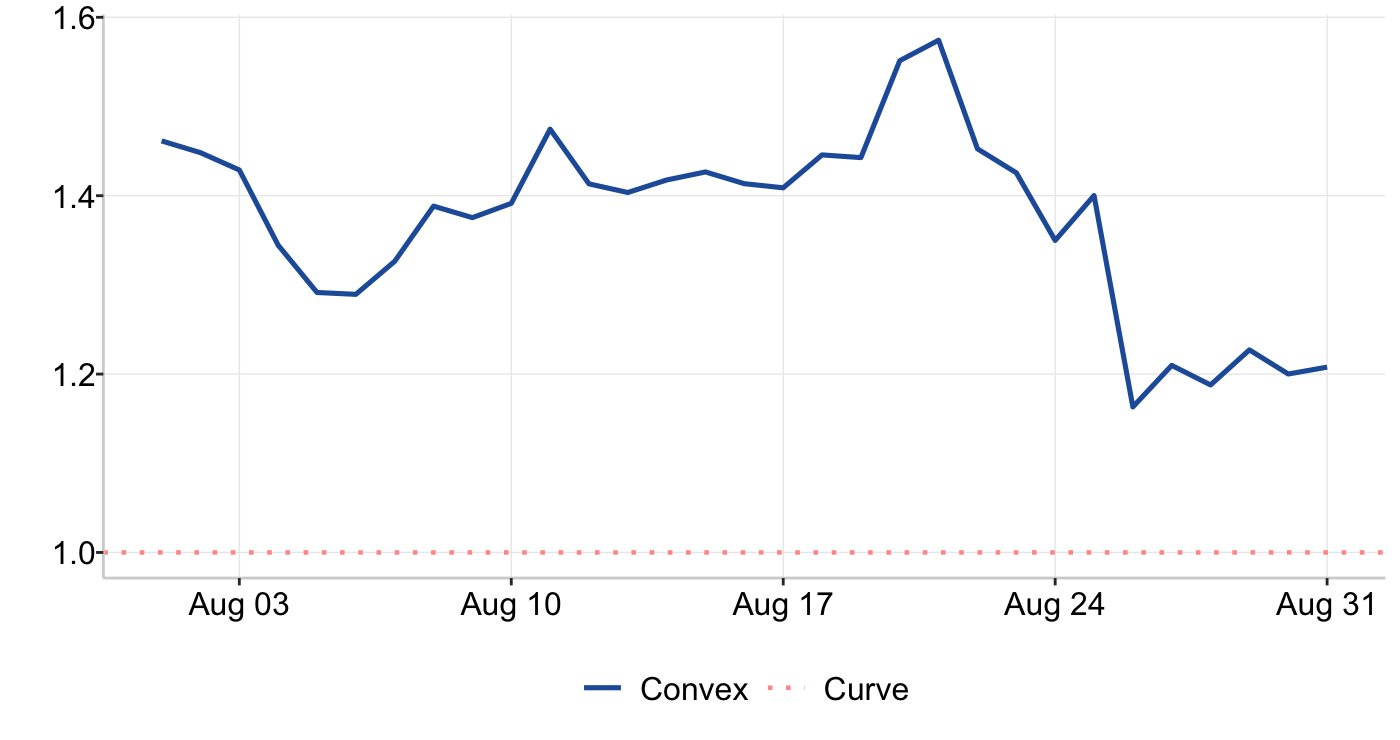
Using the above equation, the ratio is calculated for Convex (vlCVX). While Stake DAO is another viable route, it is better suited for individual users rather than the protocol itself. Graph 6 tracks the evolution of this ratio over the past month, highlighting changes in relative efficiency.
Graph 6: Kingmaker Ratio
Source: buycvxcorrect.netlify.app
The ratio averaged 1.37 throughout August, reaching a high of 1.57 and a low of 1.16. The ratio remained above 1, reinforcing Convex as the more capital-efficient route, with greater voting power per $1 spent compared with direct veCRV acquisition. This strategy has enabled RAAC to build significant governance influence within Curve.
Liquidity pools
RAAC has 4 liquidity pools active on Curve Finance:
- pmUSD/crvUSD - Launched Dec 25, 2025
- pmUSD/frxUSD - Launched Dec 25, 2025
- pmUSD/OUSD - Launched Feb 28, 2026
- iREET/pmUSD - Launched Mar 12, 2026
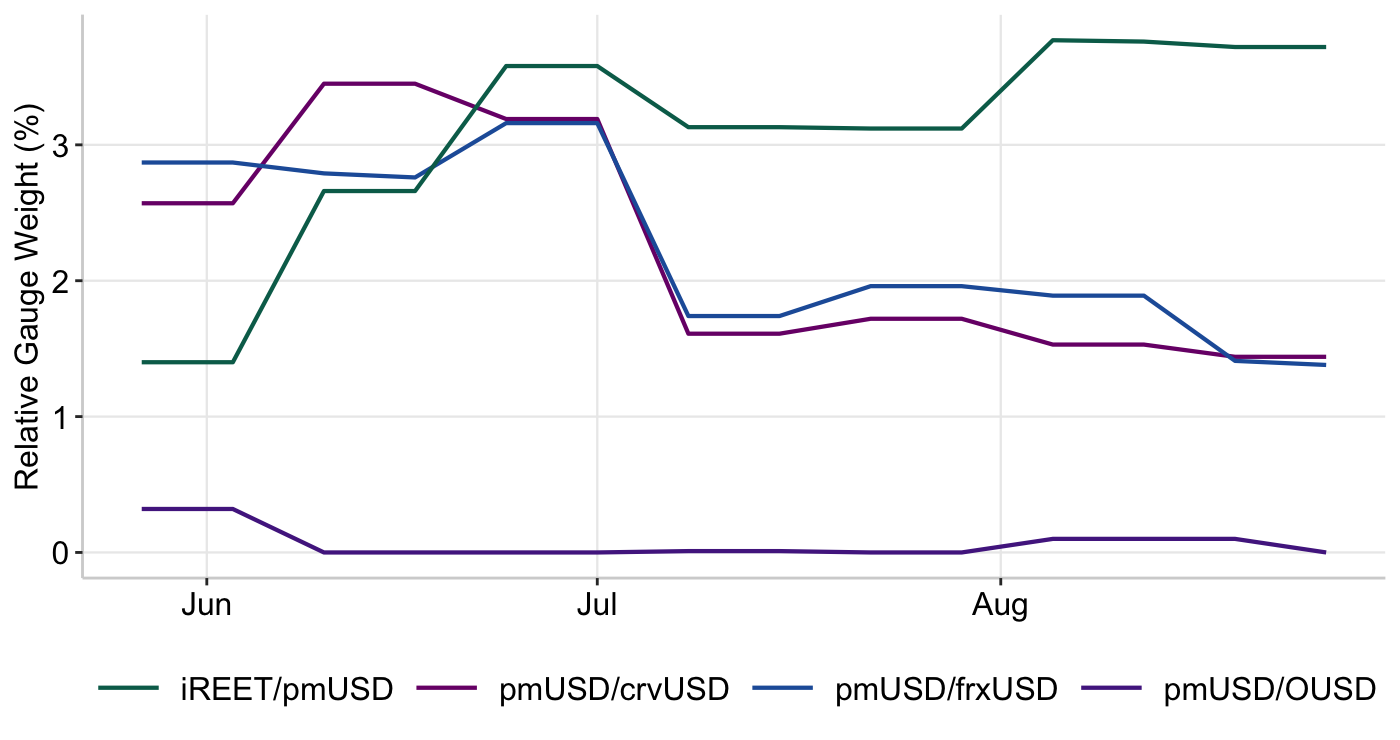
RAAC is built on the existing Curve Finance infrastructure, and Graph 9 illustrates the relative gauge weight of RAAC’s liquidity pools within the Curve Finance ecosystem.
Graph 9: RAAC Curve Pools - Gauges
Source: curve.finance
Curve’s annual emission reduction took effect on August 12, with emissions falling from 1115.5M CRV per year to 97.2M CRV per year. This represents a 15.9% reduction in the amount of new CRV entering circulation annually, intended to reduce CRV inflation and increase token scarcity over time.
As a result, all Curve gauges will proportionally receive fewer emissions, while the relative share of voting power remains unchanged. RAAC therefore retains its 4.49% share of Curve voting power, but that voting power now controls a smaller pool of newly emitted CRV. This makes existing governance power more valuable, as there is a smaller pool of newly issued CRV available for distribution.
While RAAC’s own voting power provides a base gauge weight, total veCRV gauge weighting reached 6.58% this epoch. Based on a CRV price of $0.269, this equates to approximately $65,846 in CRV emissions directed toward RAAC’s Curve pools, generating a 370.33% return on incentives and supporting competitive yields. On an annualized basis, the value of CRV emissions directed toward the RAAC Curve ecosystem is approximately $1.36M, with an annualized cash flow yield of approximately 17.1% based on vlCVX value.
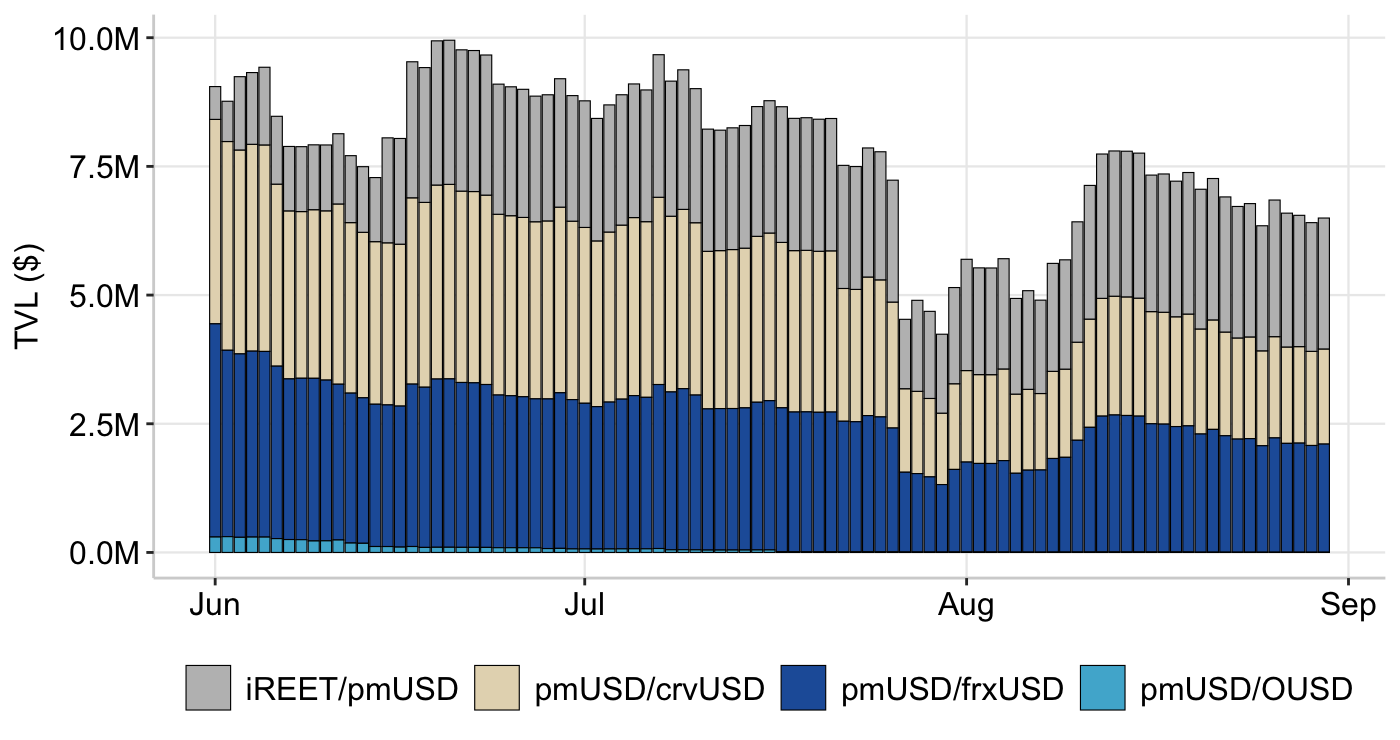
RAAC’s Curve pools maintained an average combined Total Value Locked (TVL) of $6.5 million throughout the month, with TVL increasing mid-month as pmUSD appreciated and liquidity providers added funds. The iREET/pmUSD pool held the largest share of TVL, averaging $2.4 million, followed by the frxUSD/pmUSD and crvUSD/pmUSD pools, which each averaged $2 million. RAAC also earns fees from Curve and added ~$542 worth of iREET fees back into its liquidity pools this month, further supporting liquidity depth and yield generation.
Graph 10: RAAC Curve Pools - Total Volume Locked (TVL)
 Source: https://dune.com/4sh4/raac-pmusd
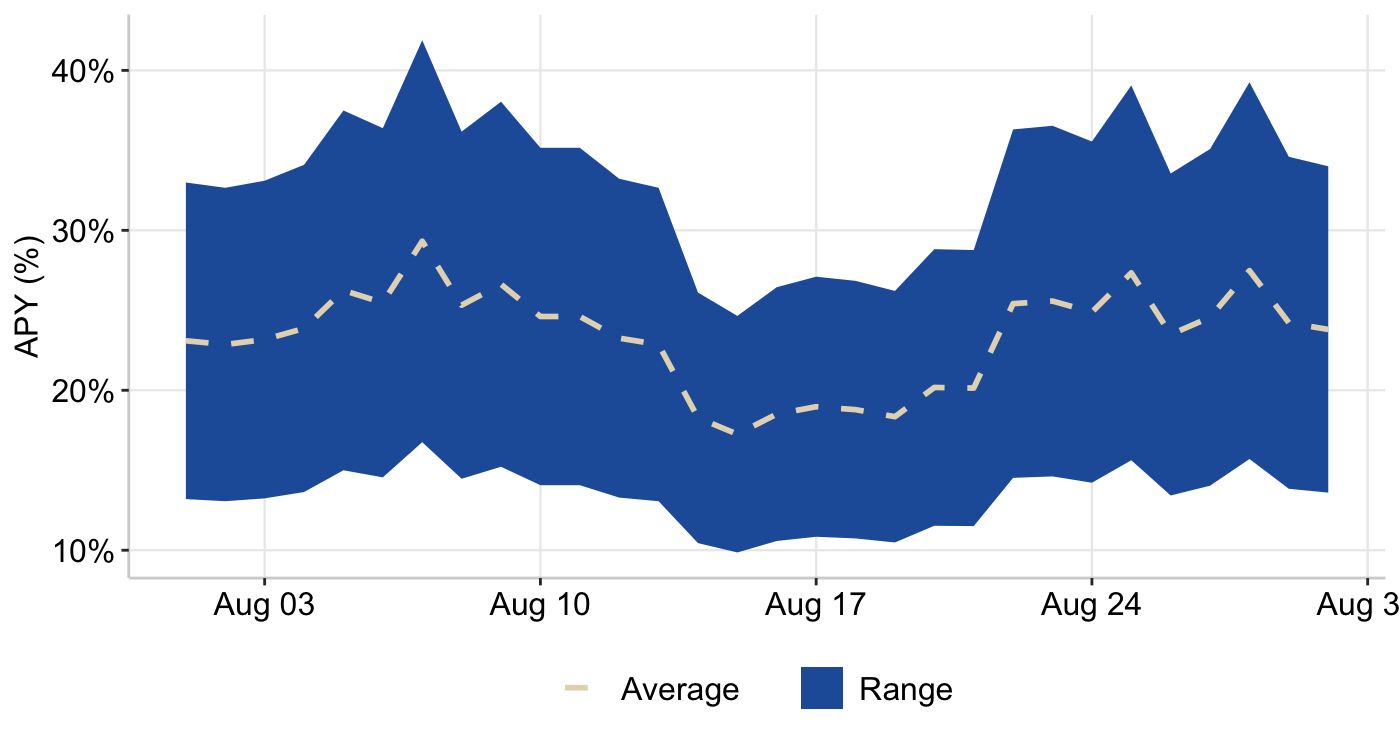
The weighted reward APY across RAAC’s Curve liquidity pools ranged from 9.86% to 41.89% over the past month. The iREET/pmUSD pool currently offers the highest returns after receiving the majority of RAAC’s voting incentives, resulting in APYs ranging from 14.3% to 59.9%, with an average yield of approximately 32%. The remaining Curve pools also continue to offer competitive yields, with both the pmUSD/crvUSD and pmUSD/frxUSD pools reaching maximum APYs of 34%.
Figure 11: RAAC Curve Pools - Weighted Reward APY
Source: curve.finance
Overall, yields across RAAC’s Curve pools remain highly competitive, with the iREET/pmUSD pool continuing to serve as the primary driver of active yield opportunities. This demonstrates that the protocol’s voting and incentive strategy continues to function as intended, even under stressed market conditions.
Participants can further enhance their yields by depositing LP tokens into protocols such as Stake DAO, Convex Finance, Beefy Finance, and Yearn Finance to access boosted rewards.
Resources
Data
https://tradingeconomics.com/indicators
https://fred.stlouisfed.org/series/DGS10
https://fred.stlouisfed.org/series/DGS5#
https://fred.stlouisfed.org/series/DGS30)
https://fred.stlouisfed.org/series/BAMLC0A0CM#
https://fred.stlouisfed.org/series/PRIME
https://fred.stlouisfed.org/series/MORTGAGE30US
https://app.koyfin.com/gyld
https://fred.stlouisfed.org/series/VIXCLS
https://defillama.com/stablecoins
https://www.coingecko.com
https://www.cboe.com/us/indices/dashboard/ovx-GVZ/
https://www.cboe.com/us/indices/dashboard/ovx/
https://www.convexfinance.com/
https://dune.com/4sh4/raac-pmusd
https://www.curve.finance/dao/ethereum/gauges
https://www.curve.finance/dex/ethereum/pools?search=pmusd
https://www.stakedao.org/yield?search=pmusd
https://curve.convexfinance.com/stake
https://app.beefy.com/
https://yearn.fi/vaults?type=lp&search=pmusd
https://app.morpho.org/ethereum/market/0x72cc79433e9f91c2a185422725510f4bdd19c9006010f464f851468b2371b756/srroyusdc-pmusd?tab=market#advanced
https://www.ssga.com/us/en/intermediary/resources/sector-tracker#fundTicker=spym\¤tTab=monthThree
News
https://www.atlanticcouncil.org/blogs/econographics/stablecoin-regulation-has-outpaced-global-coordination-the-g20-can-help/ https://www.coindesk.com/markets/2026/08/19/hype-jumps-11-as-trump-says-cftc-is-working-to-bring-hyperliquid-to-u-s
https://www.reuters.com/legal/litigation/crypto-bill-faces-long-odds-after-senate-punts-vote-september-2026-08-10/
https://finance.yahoo.com/markets/crypto/articles/another-defi-hack-term-labs-123536364.html
https://www.bloomberg.com/news/articles/2026-08-02/yen-traders-brace-for-more-intervention-with-us-at-japan-s-side
https://www.bloomberg.com/news/articles/2026-08-02/trump-says-yen-intervention-is-signal-of-friendship-with-japan
https://www.bloomberg.com/news/articles/2026-08-03/hackers-target-bitcoin-s-safest-hiding-place-in-ongoing-attack
https://www.bloomberg.com/news/articles/2026-08-03/us-manufacturing-activity-expands-at-strongest-pace-since-2022
https://www.bloomberg.com/news/articles/2026-08-02/oil-slumps-us-futures-rise-on-iran-talks-optimism-markets-wrap
https://www.bloomberg.com/news/articles/2026-08-03/stock-market-today-dow-s-p-live-updates
https://www.bloomberg.com/news/articles/2026-08-03/latest-oil-market-news-and-analysis-for-aug-4
https://www.bloomberg.com/news/articles/2026-08-03/strategy-sells-more-bitcoin-stock-as-it-pushes-on-with-overhaul
https://www.bloomberg.com/news/articles/2026-08-04/wall-street-is-deepening-its-crypto-grip-and-rewiring-the-market
https://www.bloomberg.com/news/articles/2026-08-04/stock-market-today-dow-s-p-live-updates
https://www.bloomberg.com/news/articles/2026-08-05/us-keeps-debt-sale-guidance-steady-deepening-reliance-on-bills
https://www.bloomberg.com/news/articles/2026-08-05/us-policies-reignite-debate-over-sell-america-trade-strategy
https://www.bloomberg.com/news/articles/2026-08-05/stock-market-today-dow-s-p-live-updates
https://www.bloomberg.com/news/articles/2026-08-06/stock-market-today-dow-s-p-live-updates?srnd=homepage-canada
https://www.bloomberg.com/news/articles/2026-08-07/bond-traders-look-to-jobs-data-that-may-tip-scale-on-fed-hike?srnd=homepage-canada
https://www.bloomberg.com/news/articles/2026-08-07/us-employers-unexpectedly-shed-jobs-unemployment-rate-falls?itm_source=record&itm_campaign=US_Jobs_Report&itm_content=July_Report-1
https://www.bloomberg.com/news/articles/2026-08-04/gold-holds-steady-as-progress-on-hormuz-trims-rate-hike-bets
https://www.bloomberg.com/news/articles/2026-08-05/why-are-mortgage-rates-so-high-effects-of-inflation-iran-war
https://www.bloomberg.com/news/articles/2026-08-04/chinese-dip-buying-bolsters-gold-as-prices-find-floor-at-4-000
https://www.bloomberg.com/news/features/2026-08-09/china-bets-on-ai-stocks-as-it-races-against-us-for-chip-tech-dominance
https://www.bloomberg.com/news/articles/2026-08-08/a-tough-week-for-crypto-has-fans-downing-drinks-at-a-bitcoin-bar
https://www.bloomberg.com/news/articles/2026-08-09/stock-market-today-dow-s-p-live-updates
https://www.bloomberg.com/news/articles/2026-08-10/bitcoin-btc-etf-inflows-hit-850-million-after-coldcard-wallet-hack
https://www.bloomberg.com/news/articles/2026-08-10/robinhood-to-offer-access-to-crypto-trading-in-uk-from-this-week
https://www.bloomberg.com/news/articles/2026-08-10/us-futures-drop-as-focus-turns-on-chipmaker-earnings-inflation
https://www.bloomberg.com/news/articles/2026-08-10/intel-selling-15-billion-in-common-stock-to-fund-growth
https://www.bloomberg.com/graphics/2026-leveraged-etf-ai-companies/
https://www.bloomberg.com/news/articles/2026-08-11/blackstone-backed-reit-agrees-to-buy-h-r-in-c-3-4-billion-deal
https://www.bloomberg.com/news/articles/2026-08-10/stock-market-today-dow-s-p-live-updates
https://www.bloomberg.com/news/articles/2026-08-11/nvidia-s-show-of-financial-force-soothes-jittery-credit-markets
https://www.bloomberg.com/news/articles/2026-08-12/iea-sees-wider-oil-supply-deficit-despite-hit-to-demand-from-war
https://www.bloomberg.com/news/articles/2026-08-11/stock-market-today-dow-s-p-live-updates
https://www.bloomberg.com/news/articles/2026-08-12/yen-intervention-puts-yuan-under-even-more-appreciation-pressure
https://www.bloomberg.com/news/articles/2026-08-12/us-stock-futures-rise-as-tech-rally-resumes-before-key-cpi-data
https://www.bloomberg.com/news/articles/2026-08-12/jpy-usd-why-yen-intervention-by-japan-and-us-has-limited-impact
https://www.bloomberg.com/news/articles/2026-08-12/potential-peak-earnings-set-the-stage-for-disappointing-stocks
https://cryptorank.io/news/feed/4365f-curve-dao-token-crv-price-rallies-into-major-resistance-zone-can-it-break-0-3
https://news.curve.finance/crv-emission-rate-gets-a-cut-as-programmed/
https://www.bloomberg.com/news/articles/2026-08-13/mortgage-rates-in-the-us-edge-lower-for-first-time-in-six-weeks
https://www.bloomberg.com/news/articles/2026-08-13/gold-steadies-as-traders-weigh-fed-rate-path-and-mideast-tension
https://www.bloomberg.com/news/articles/2026-08-13/bank-of-korea-makes-first-gold-linked-investment-in-13-years
https://www.bloomberg.com/news/articles/2026-08-17/dollar-extends-slide-as-traders-scale-back-fed-tightening-bets
https://www.bloomberg.com/news/articles/2026-08-17/ai-is-driving-up-treasury-yields-it-just-touches-everything
https://www.bloomberg.com/news/articles/2026-08-16/stock-market-today-dow-s-p-live-updates
https://www.bloomberg.com/news/articles/2026-08-13/crypto-firm-tether-says-kpmg-completes-long-promised-audit
https://www.bloomberg.com/news/articles/2026-08-14/kraken-parent-payward-reports-earnings-slump-amid-crypto-winter
https://www.bloomberg.com/news/articles/2026-08-17/bitcoin-etfs-see-largest-outflow-in-six-weeks-as-token-stagnates
https://www.bloomberg.com/news/articles/2026-08-19/long-dated-treasuries-rally-as-treasury-boosts-bond-buybacks
https://www.bloomberg.com/news/articles/2026-08-18/anthropic-pre-ipo-credit-facility-set-to-climb-past-10-billion
https://www.bloomberg.com/news/articles/2026-08-18/us-10-year-yields-climb-to-highest-since-2025-as-rout-deepens
https://www.bloomberg.com/news/articles/2026-08-18/ai-election-backlash-is-shaping-wall-street-s-stock-market-views
https://www.bloomberg.com/news/articles/2026-08-17/stock-market-today-dow-s-p-live-updates
https://www.bloomberg.com/news/articles/2026-08-18/bond-rout-sends-long-term-borrowing-costs-to-highest-in-decades
https://www.bloomberg.com/news/articles/2026-08-16/bonds-face-a-bigger-threat-than-the-fed-as-global-rates-climb
https://www.bloomberg.com/news/articles/2026-08-18/bitcoin-whales-end-selling-spree-adding-2-9-billion-in-60-days?srnd=phx-crypto
https://www.bloomberg.com/news/articles/2026-08-19/bitcoin-surges-most-since-march-ahead-of-white-house-meeting?srnd=phx-crypto
https://www.bloomberg.com/news/articles/2026-08-20/bitcoin-btc-roars-past-70-000-as-yields-sink-trump-cour
https://www.bloomberg.com/news/articles/2026-08-20/bessent-s-plan-at-best-circuit-breaker-for-global-bond-slump
https://www.bloomberg.com/news/articles/2026-08-20/bessent-says-buybacks-could-be-more-than-4-billion-per-issue
https://www.bloomberg.com/news/articles/2026-08-20/us-mortgage-rates-fall-for-second-straight-week-to-6-65
https://www.bloomberg.com/news/articles/2026-08-12/stock-market-today-dow-s-p-live-updates https://www.bloomberg.com/news/articles/2026-08-20/stock-market-today-dow-s-p-live-updates
https://www.bloomberg.com/news/articles/2026-08-20/dollar-risks-becoming-biggest-loser-from-bessent-s-bond-buying
https://www.bloomberg.com/news/articles/2026-08-23/bessent-has-no-easy-fix-for-what-s-really-driving-bond-yields-up
https://www.bloomberg.com/news/articles/2026-08-23/-it-s-a-carry-world-em-trade-notches-longest-run-since-2008
https://www.bloomberg.com/news/articles/2026-08-24/bitcoin-etfs-see-biggest-weekly-inflow-in-10-months-during-rally
https://www.bloomberg.com/news/articles/2026-08-21/dalio-says-sell-bonds-buy-gold-bitcoin-as-debt-crisis-looms
https://www.bloomberg.com/news/articles/2026-08-23/stock-market-today-dow-s-p-live-updates
https://www.bloomberg.com/news/articles/2026-08-24/the-500-billion-experiment-to-build-24-7-markets-on-blockchain
https://www.bloomberg.com/news/articles/2026-08-24/stock-market-today-dow-s-p-live-updates
https://www.bloomberg.com/news/articles/2026-08-24/strategy-sets-up-new-reserve-that-can-be-used-to-buy-bitcoin
https://www.bloomberg.com/news/articles/2026-08-25/bitcoin-reaches-three-month-high-of-80-000-as-momentum-returns
https://www.bloomberg.com/news/articles/2026-08-25/us-weighs-more-trade-measures-against-canada-after-retaliation
https://www.bloomberg.com/news/articles/2026-08-25/asian-stocks-set-to-gain-as-oil-extends-declines-markets-wrap
https://www.bloomberg.com/news/articles/2026-08-26/revolut-joins-global-stablecoin-race-with-euro-backed-token
https://www.bloomberg.com/news/articles/2026-08-26/trump-s-policies-find-an-unlikely-beneficiary-canadian-stocks
https://www.bloomberg.com/news/articles/2026-08-26/nvidia-estimate-topping-forecast-fails-to-wow-investors
https://www.bloomberg.com/news/articles/2026-08-26/nasdaq-futures-rise-on-bullish-nvidia-sales-growth-markets-wrap
https://cryptonews.com/news/ethereum-etf-inflows-189-million/
https://finance.yahoo.com/markets/crypto/articles/bitmine-187-000-eth-away-120739851.html
https://www.bloomberg.com/news/articles/2026-08-27/gold-holds-near-4-600-as-investors-focus-on-fed-rate-hike-path
https://www.bloomberg.com/news/articles/2026-08-27/us-mortgage-rates-rise-slightly-to-6-66-freddie-mac-says https://www.bloomberg.com/news/articles/2026-08-27/stock-market-today-dow-s-p-live-updates
https://www.bloomberg.com/news/articles/2026-08-26/bitcoin-and-gold-etfs-draw-7-billion-as-scarcity-trade-surges
https://www.bloomberg.com/news/articles/2026-08-27/gold-holds-near-4-600-as-investors-focus-on-fed-rate-hike-path