
Overview
Macroeconomic conditions continue to signal stable growth following the U.S. Federal Reserve’s third consecutive rate cut. However, long-term bond yields remain elevated while credit spreads have narrowed, pushing investors toward alternative sources of yield.
Cryptocurrency markets underperformed in December, even as stablecoin supply continued to expand. RAAC’s pmUSD launched successfully, and growth in Curve-native stablecoins (pmUSD and crvUSD) outpaced that of other stablecoins, indicating the importance of Curve-based liquidity. Lower on-chain borrowing yields allow RAAC to accumulate CRV and CVX efficiently, while the Kingmaker Ratio confirms that Convex remains the most capital-efficient avenue for influencing Curve liquidity.
Precious metals significantly outperformed in 2025, supported by monetary easing and sustained central-bank demand. Rising gold prices strengthen RAAC’s collateral base, enhancing lending safety and yield sustainability. Meanwhile, the tokenized commodities market expanded in 2025 led by tokenized gold signaling robust demand for RWA-backed assets.
Macroeconomic & Traditional Finance Outlook
United States
Last month, the Federal Open Market Committee (FOMC) delivered a third consecutive interest-rate reduction, lowering the federal funds rate by a quarter point to a range of 3.5%–3.75%. The Fed claims it has bolstered the economy sufficiently against threats to employment and price pressures.
The Fed’s updated 2026 economic projections reflect growing optimism, with forecasts pointing to stronger GDP growth and modestly lower inflation.
Table 1: US Indicators
| Indicator | Period | Actual | Previous | Consensus |
|---|---|---|---|---|
| GDP | Q3 | 4.3% | 3.8% | 3.3% |
| Unemployment | Nov | 4.6% | 4.4% | 4.4% |
| Consumer Price Index | Nov | 2.7% | N/A | 3.1% |
| 1YR Inflation Expectations | Dec | 4.2% | 4.5% | 4.1% |
Source: tradingeconomics
Notes: GDP advanced at an annualized rate of 4.3%—the fastest pace in two years—driven by strong consumer spending, exports, and government expenditure. The labour force participation rate was largely unchanged, indicating a stable labour supply. CPI came in below expectations, with energy prices rising 4.2% and shelter costs up 3%. One-year inflation expectations fell to their lowest level in a year.
Table 2: Truflation US CPI Inflation Index (Year-over-Year)
| Period | Highest | Lowest | Average |
|---|---|---|---|
| Dec | 2.70% | 1.99% | 2.43% |
| Nov | 2.71% | 2.32% | 2.51% |
Source: truflation
Notes: The Truflation CPI Index relies on current consumer and spending data to deliver daily inflation readings that better capture rapid economic changes overlooked by traditional inflation measures.
Looking ahead to 2026, the Fed maintained its outlook for a single rate cut, while investors continue to price in two to three cuts over the year.
Following the Fed’s decision, commercial banks lowered their prime lending rate from 7.00% to 6.75%. The Fed’s measured approach to rate cuts is likely to keep longer-term interest rates and mortgage rates near current levels unless inflation shows clearer and sustained easing or labour market conditions weaken. Nonetheless, gradual declines in interest rates are expected to be sufficient to partially offset ongoing increases in home prices, offering some improvement in housing affordability.
For RAAC, this environment is supportive. Lower rates make borrowing cheaper, which increases demand for loans. At the same time, stable growth and easing inflation help protect the value of real-world collateral such as real estate and commodities.
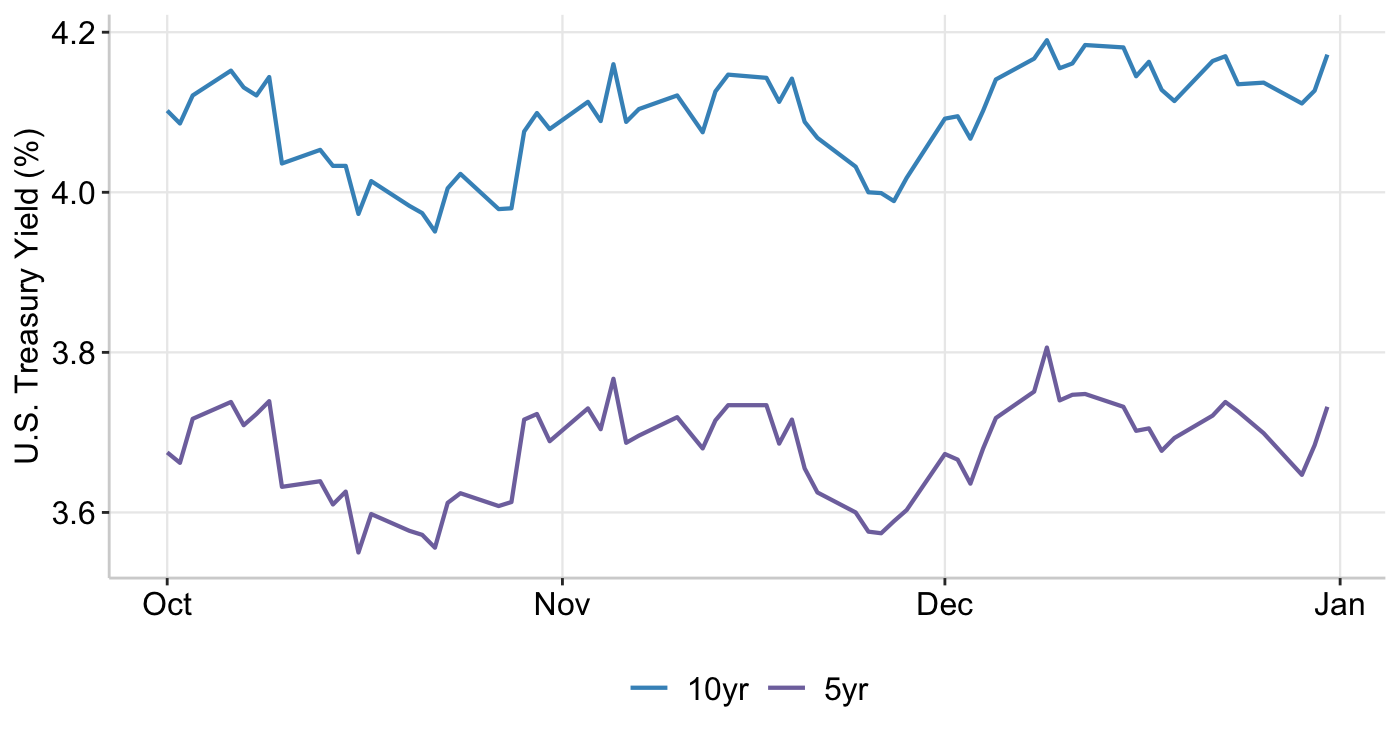
The 5-year and 10-year yields have not diverged throughout 2025. However, both maturities are ending the year at lower levels than where they began. In December, yields across both tenors briefly spiked in anticipation of Fed announcements, with the 5-year reacting more sharply than its longer-dated counterpart. Despite this, long-term bond yields remain elevated, and many economists view a 4.5% yield on the 10-year Treasury as the new normal.
Graph 1: US 5 year & 10 year Bonds
Source: Koyfin
Typically, when central banks cut policy rates, bond yields are expected to decline. However, long-term yields may remain structurally elevated due to rising public debt and heightened political risk, even as short-term interest rates fall. This environment increases the risk of holding longer-duration bonds, prompting investors to demand a higher term premium. As a result, the 10-year U.S. Treasury yield is unlikely to decline meaningfully without a period of significant financial repression.
U.S. high-grade corporate bond spreads narrowed earlier in December, reaching their tightest level since October at 0.78 percentage points. This compression was most likely driven by minimal year-end issuance, which created scarcity in the market. However, the Fed’s rate cut contributed to a modest widening in spreads, and the resumption of heavier issuance could push spreads wider in the coming months. Despite these near-term dynamics, the broader trend in 2025 has been one of gradual tightening. Credit spreads peaked at 1.21 percentage points in April 2025 and have not returned to those levels since, ending December at 0.79.
As interest rates have declined and credit spreads have narrowed, generating attractive yields in traditional, publicly traded fixed-income markets has become increasingly challenging. As a result, investors are seeking yield beyond traditional markets, aiming to enhance income by taking on additional risk in exchange for higher expected returns.
The money supply (M2) continues to expand, driven by interest rate cuts and increased liquidity provision, reaching approximately $22 trillion by year-end. Historical patterns suggest that Bitcoin prices tend to rise alongside growth in global money supply. This relationship reflects Bitcoin’s fixed supply: as fiat money creation increases and purchasing power is diluted, scarce assets become relatively more attractive. As a result, rising money supply may indirectly support stronger demand for cryptocurrencies.
The U.S. housing market is expected to become more affordable in 2026, primarily because wage growth is projected to outpace home price appreciation, which is forecast at 1.5%. As a result, homes should become cheaper in real terms. However, the market is unlikely to experience a boom, as a slow and gradual recovery is anticipated. The key risk lies in the labour market: a rise in layoffs could weaken housing demand and prompt the FOMC to adopt a more aggressive rate-cutting stance.
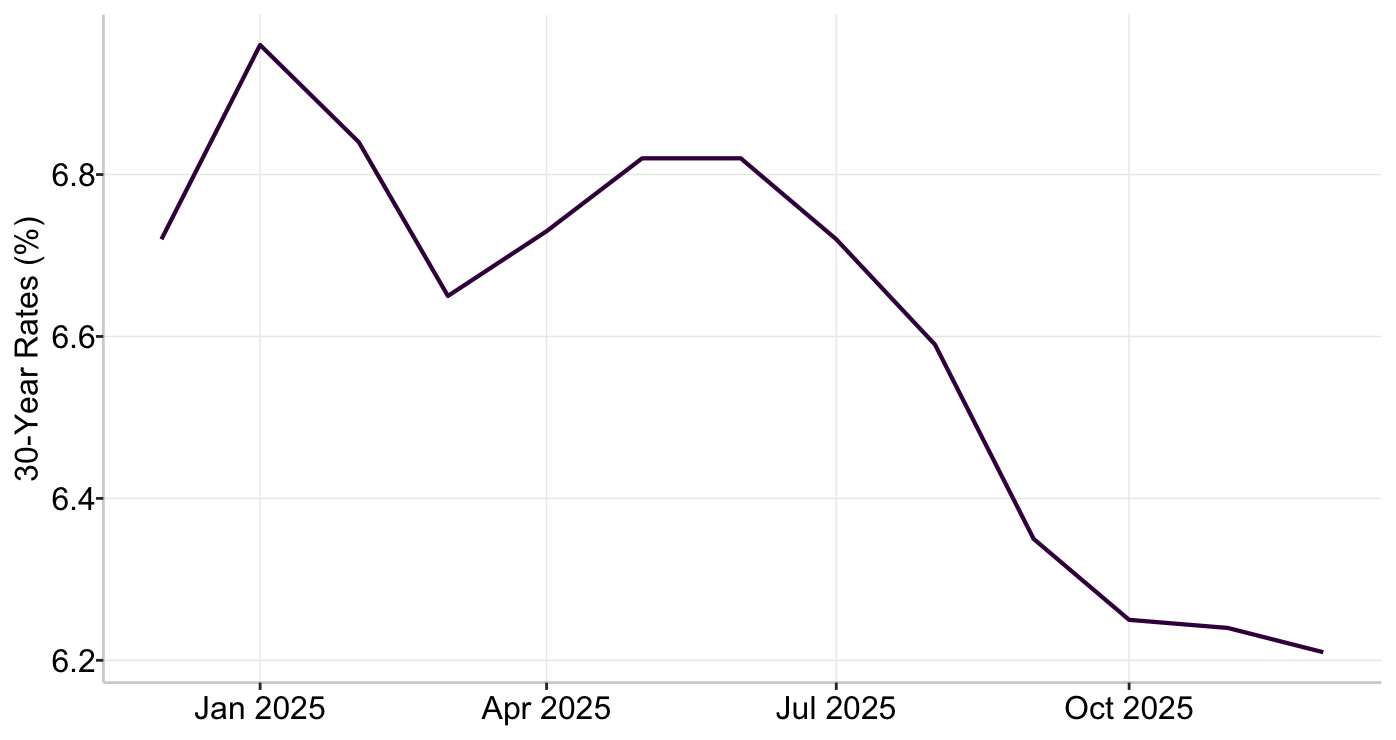
Graph 2: US 30-Year Mortgage Rates
Source: FRED
Mortgage rates have already eased from above 7% to around 6.2%, encouraging some homeowners to sell and providing relief to marginal buyers, but remaining too high to generate strong demand. Most analysts expect mortgage rates to stay near current levels in 2026, while some anticipate a gradual drift toward 6.5%. As a result, the housing outlook is more closely linked to labour market stability and Fed policy than to price momentum.
Overall, the current conditions support RAAC’s model. Lower rates increase borrowing demand, stable growth supports collateral quality, weaker bond returns push investors toward alternative yield, and rising liquidity supports on-chain adoption. Together, these factors strengthen RAAC’s strategies.
Equities
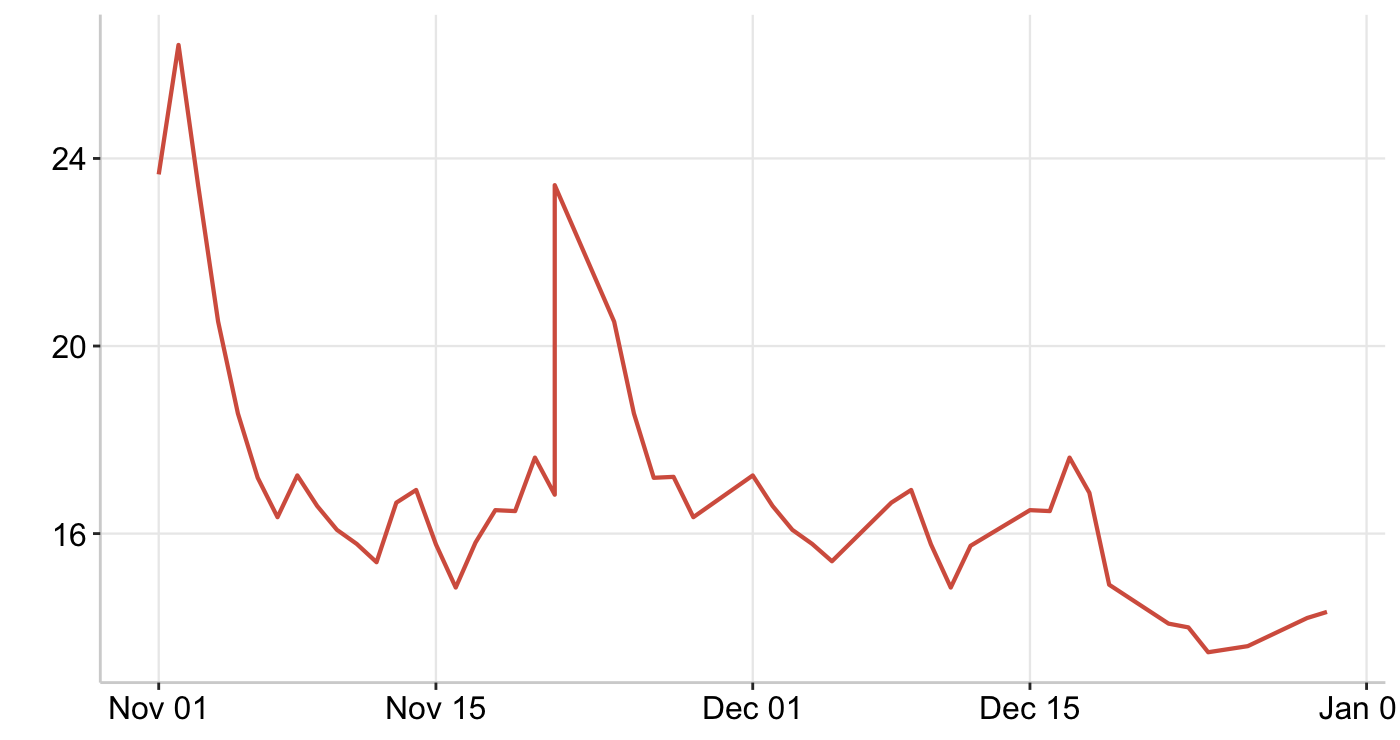
In mid-December, U.S. equities declined for four consecutive sessions as investors rotated out of expensive AI and technology stocks amid fading momentum. This move pushed the S&P 500 below its 50-day moving average and lifted the Volatility Index (VIX) to a monthly high of 17.62. As technology stocks weakened, capital rotated into cash-flow-generative sectors such as energy. By month-end, equities rebounded to close at record highs, supported by expectations of strong earnings growth and a manageable Fed policy stance in the year ahead. Correspondingly, the VIX trended lower as market volatility subsided.
Graph 3: CBOE SPX Volatility Index
Source: FRED
World Currencies
Month-to-date data for December shows the U.S. dollar weakening against most major currencies as the Fed adopted a more dovish stance. Markets are increasingly positioning for continued dollar softness in 2026. European and commodity-linked currencies outperformed amid improving global growth expectations and increased liquidity. In contrast, the Japanese yen remained one of the weakest major currencies, underperforming across pairs, consistent with ongoing monetary policy divergence.
Table 3: World Currencies Performance (Month-to-Date)
| USD | EUR | GBP | JPY | CAD | |
|---|---|---|---|---|---|
| USD | -1.2% | -1.6% | 0.3% | -1.9% | |
| EUR | 1.3% | -0.4% | 1.6% | -0.6% | |
| GBP | 1.6% | 0.4% | 2.0% | -0.3% | |
| JPY | -0.3% | -1.6% | -1.9% | -2.2% | |
| CAD | 1.9% | 0.6% | 0.3% | 2.3% |
Source: Koyfin
Decentralized Finance Outlook
Cryptocurrencies
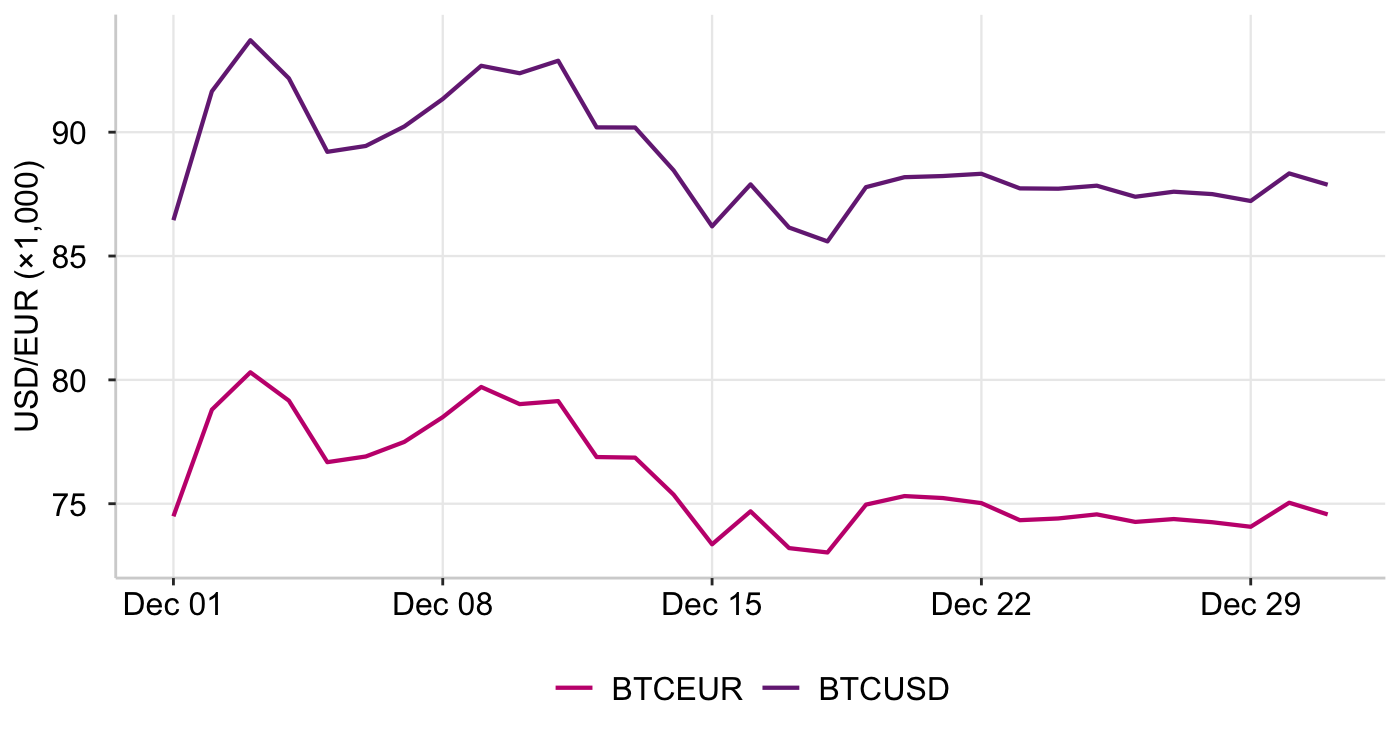
Crypto markets have had a difficult December, with prices broadly declining across the sector. Bitcoin (BTC) experienced its sharpest drawdown since 2021 and has remained range-bound between $85,000 and $90,000, even as equities and gold have rallied. Bitcoin has underperformed expectations, is down more than 7% for the year, and is on track for its weakest quarter since 2022.
Earlier in the year, Bitcoin traded as a risk-on asset alongside technology stocks, but momentum has since faded as investors prefer equities for growth and gold for safety, leaving crypto investors struggling to remain optimistic. Weak sentiment has been compounded by downward revisions to earnings expectations from Bitcoin’s largest holders.
Graph 4: Bitcoin vs USD/EUR
Source: Koyfin
Other major cryptocurrencies have been hit even harder. Ethereum (ETH) has hovered around $2,900 throughout December and has been unable to reclaim gains made in October, highlighting broader weakness across the crypto market.
Stablecoins
Stablecoins are cryptocurrencies designed to maintain a stable value. Users often hold stablecoins since they offer less volatility compared to Bitcoin and Ethereum. Overall, they preserve capital while allowing users to remain on-chain. RAAC operates on the Ethereum blockchain, which is the dominant network for stablecoins.
The stablecoin market capitalization has shown a clear upward trend, indicating growing demand for on-chain dollars. The Ethereum blockchain currently hosts approximately $166.97 billion in stablecoin supply, accounting for about 54% of the total global stablecoin market. This makes Ethereum the most important blockchain for stablecoins by a wide margin. Tether (USDT) remains the largest stablecoin on Ethereum, but growth is increasingly distributed across multiple dollar-pegged assets with different designs and risk profiles.
The following table showcases the monthly change in market capitalization for RAAC’s PMUSD versus other relevant stablecoins. Changes in stablecoin supply reflect capital flows and investor behaviour.
Table 4: 1 Month Market Capitalization Change (%)
| Stablecoin | PMUSD | CRVUSD | USDC | FRAXUSD | FXUSD | RLUSD | PYUSD |
|---|---|---|---|---|---|---|---|
| 1 M Change | +100% | +21.99% | +7.67% | -11.36% | -26.34% | +5.98% | -8.44% |
Source: DefiLlama
RAAC’s pmUSD launched this month with a total supply of $9.0 million, and the 100% month-over-month increase reflects the initial onboarding of capital into the RAAC ecosystem. CRVUSD also recorded strong growth (+21.99%), signaling rising on-chain borrowing activity and increased liquidity demand within the Curve ecosystem. In contrast, more established stablecoins such as USDC and PYUSD exhibited modest or negative growth.
As mentioned previously, Ethereum’s price has been declining while stablecoin supply continues to rise. This divergence suggests that investors are rotating out of volatile assets like ETH and into stablecoins to manage risk. This environment benefits RAAC as pmUSD is entering the market at a time when users are seeking stability rather than speculation.
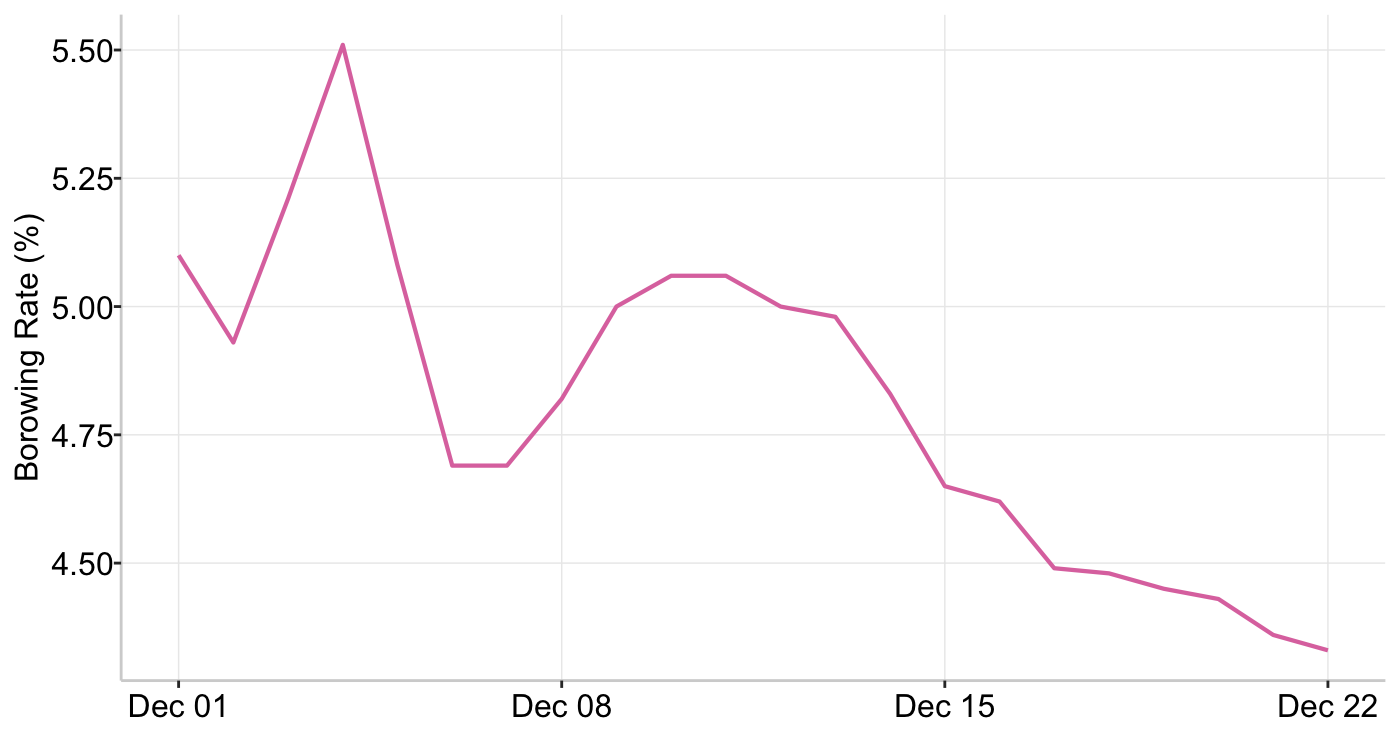
The Ethereum stablecoin borrowing rate represents the average interest cost to borrow dollar-pegged stablecoins across lending protocols on Ethereum and sets the baseline yield environment for Defi. As shown in the graph below, a decline in Ethereum stablecoin borrowing rates indicates reduced demand for leverage and a more risk-averse market environment.
Graph 5: Ethereum Stablecoin Borrowing Rate
Source: Blockworks
When borrowing rates fall across Ethereum, stablecoin yields tend to compress. This may place downward pressure on APYs across the ecosystem. However, this does not automatically imply weaker performance for RAAC. This environment can be favorable for RAAC’s RWA-backed model as crypto borrowing declines, demand can shift towards stable, real-world asset-backed yields. This positions RAAC as a defensive, yield-stable alternative during periods of reduced crypto risk appetite.
Convex and Curve Protocol
RAAC builds directly within the Curve ecosystem, using crvUSD as a core settlement and lending asset for pmUSD and RWA-backed lending pools. By operating natively on Curve and leveraging Convex, RAAC maximizes both yield efficiency and governance influence, allowing it to direct liquidity incentives toward its pools while minimizing long-term incentive costs.
Table 5: Protocols’ APY and Holders Revenue
| Uniswap | Convex | Curve | |
|---|---|---|---|
| Average APY | 38.93% | 7.70% | 4.73% |
| Holders Revenue (30d) | N/A | $108,939 | $602,635 |
Source: DeFiLlama
Compared to protocols such as Uniswap, Curve and Convex exhibit lower average yields, and for RAAC this environment is structurally supportive rather than restrictive. Lower yields across Curve and Convex indicate a shift away from short-term capital, and towards a more stable and liquid environment.
This benefits RAAC in several ways. First, liquidity becomes more durable, reducing volatility in pmUSD pools. Second, RAAC can accumulate CRV and CVX more efficiently, as the opportunity cost of holding governance tokens declines when competing yields are lower. Third, this yield environment aligns closely with RAAC’s RWA-backed model, where returns are designed to resemble traditional finance risk-adjusted yields rather than high-volatility crypto incentives.
Therefore, PMUSD becomes more attractive as a stable, and RAAC can support liquidity without overspending on incentives, helping the protocol remain sustainable over the long term.
Within the Curve and Convex ecosystem, holders revenue reflects the value generated and distributed to participants who lock tokens, provide liquidity, or hold governance positions. For RAAC, this metric is critical in assessing whether the ongoing cash flows from CRV and CVX justify their acquisition and long-term holding.
The consistent holders revenue observed across both Curve and Convex suggests that CRV and CVX are productive governance assets, making them suitable instruments for deploying RAAC’s treasury capital to both earn yield and maintain control over liquidity direction.
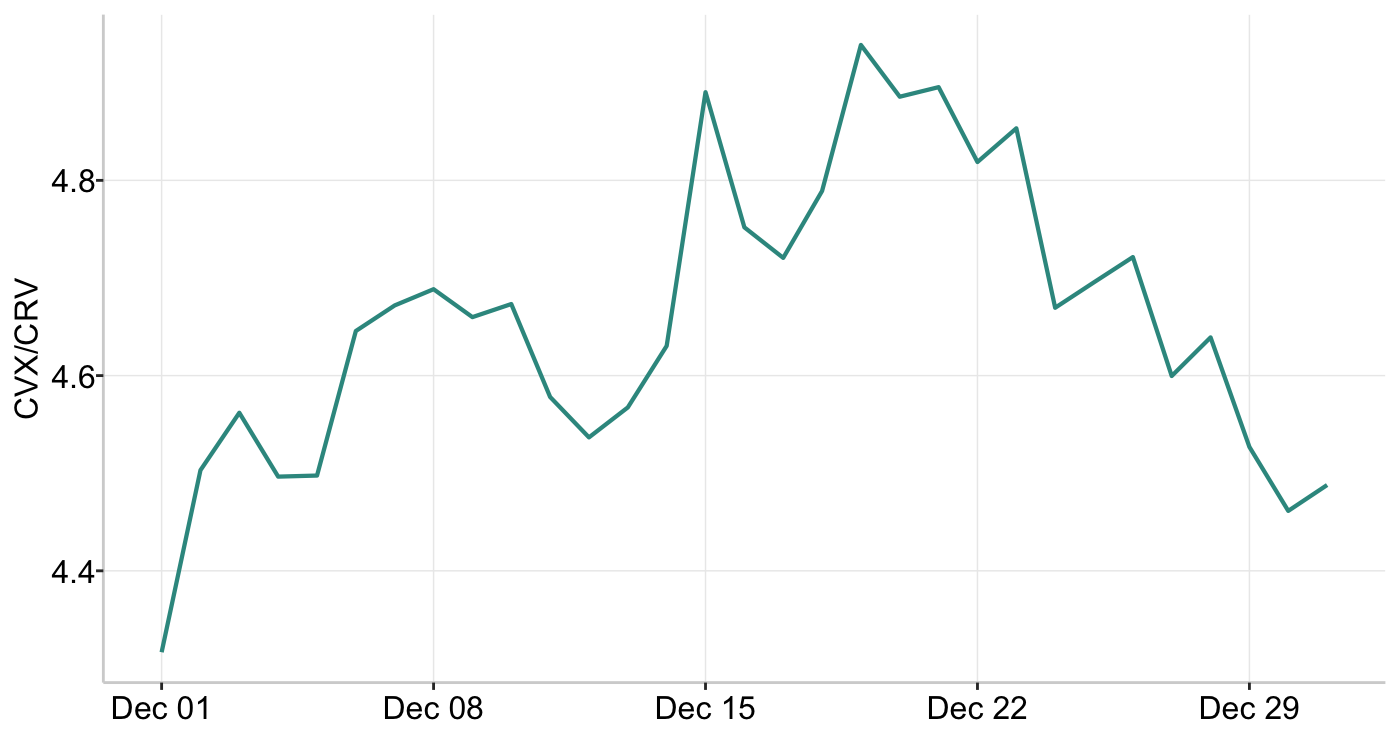
The Kingmaker Ratio below shows how much liquidity control RAAC can buy through Convex instead of Curve. A rising ratio indicates that accumulating CVX is the most efficient way for RAAC to dominate pmUSD liquidity on Curve.
Graph 6: King-Maker Ratio
Source: coingecko
The upward trend observed through mid-December indicates that Convex voting power became more valuable relative to direct Curve exposure. For RAAC, this confirms that accumulating CVX and utilizing Convex vote markets remained the most capital-efficient strategy for influencing CRV emissions and securing pmUSD liquidity. Although the ratio moderated towards the end of the month, it stayed elevated compared with early-month levels, suggesting that Convex continues to be the dominant mechanism for directing Curve liquidity.
RAAC Bots
In December, the RAAC Bots floor price stayed around ~0.10 ETH, reflecting low trading activity and limited demand during the period. A brief dip toward ~0.09 ETH occurred when trading volume was near zero, but prices quickly returned as listings were purchased.
Real-World Assets
RAAC uses real-world assets (RWAs) as collateral to back its stablecoin, providing greater stability compared to models that rely on volatile cryptocurrencies as collateral. The following section examines how each underlying asset is currently performing in the market.
RAACLend
RAACLend focuses on U.S. real estate participating in the Housing Choice Voucher Program (HCVP), which is supported by rental income rather than home price appreciation. While slow home price growth and relatively high mortgage rates primarily impact homebuyers, HCVP properties are less affected because demand for affordable rental housing remains strong and rent payments are reliable. As a result, the cash flow supporting RAACLend loans remains stable.
RWAf(x)
RAAC’s RWAf(x) protocol allows users to gain exposure to tokenized real-world assets like gold, silver, and energy commodities.
In December, WTI crude oil traded between a high of $60.02/bbl and a low of $55.27/bbl, finishing the year at $57.44/bbl. December recorded one of the lowest oil price levels of the year, alongside early May 2025.
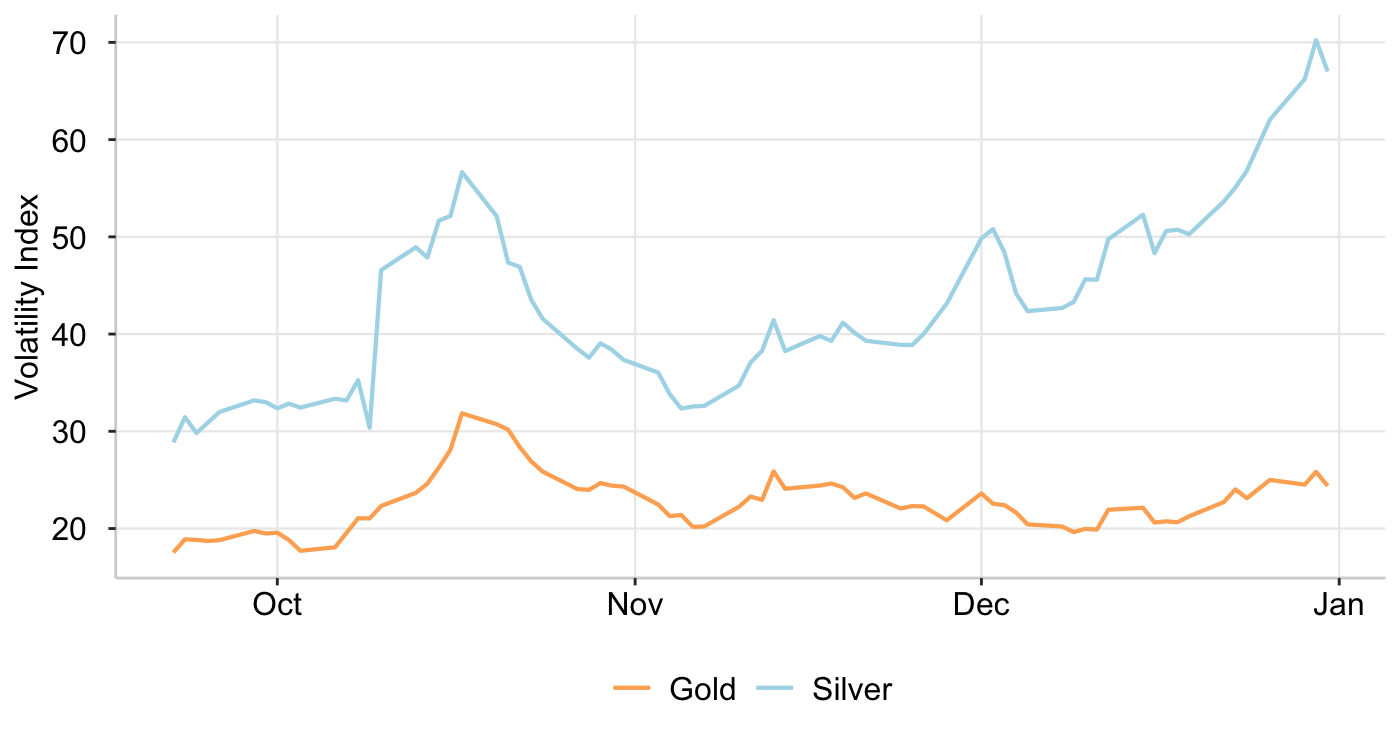
2025 has been a historic year for precious metals. Silver prices have more than doubled, while gold is up nearly two-thirds. Both metals are on track for their strongest annual performance since 1979, as shifting monetary policy expectations have become the dominant driver of precious-metal pricing.
Graph 7: CBOE Gold/Silver ETF Volatility Index
Source: CBOE
Silver has trended upward throughout the year, reaching a high of $78 USD on December 26. Ahead of the Fed’s December policy decision, silver outperformed gold but also exhibited greater volatility in recent months. Tariff concerns and silver’s inclusion on the U.S. critical minerals list have reduced arbitrage efficiency, keeping a larger share of supply onshore.
Gold (USD/oz) has also followed an upward trajectory. In December, prices ranged between a high of $4537 USD and a low of $4192 USD while displaying moderate volatility compared to silver. Following weaker-than-expected U.S. inflation data from November, gold traded near record highs as expectations for further interest-rate cuts strengthened.
After the holidays, a rapid year-end rally pushed gold and silver prices to record highs, prompting profit-taking by traders. Lower trading volumes amplified the sell-off, making the price decline appear more pronounced than usual. The pullback was driven by trading mechanics and positioning rather than any changes in fundamentals, indicating that confidence in precious-metals remains intact.
The current rise in precious-metal prices is supported by structurally strong central-bank demand and cyclical support from Fed rate cuts. However, gold prices could face downside risk if the Fed slows or pauses its easing cycle in 2026, potentially pushing prices below $4,000 per ounce. Overall, precious metals remain supported by monetary easing, though volatility is likely as policy expectations continue to evolve.
Higher prices increase the underlying value of the tokenized commodities, strengthening RAAC’s collateral base. This makes lending and borrowing against these tokenized assets safer for the protocol, as the assets are appreciating and remain in demand. However, when RAAC incorporates silver in the future, its higher volatility may necessitate increased over-collateralization.
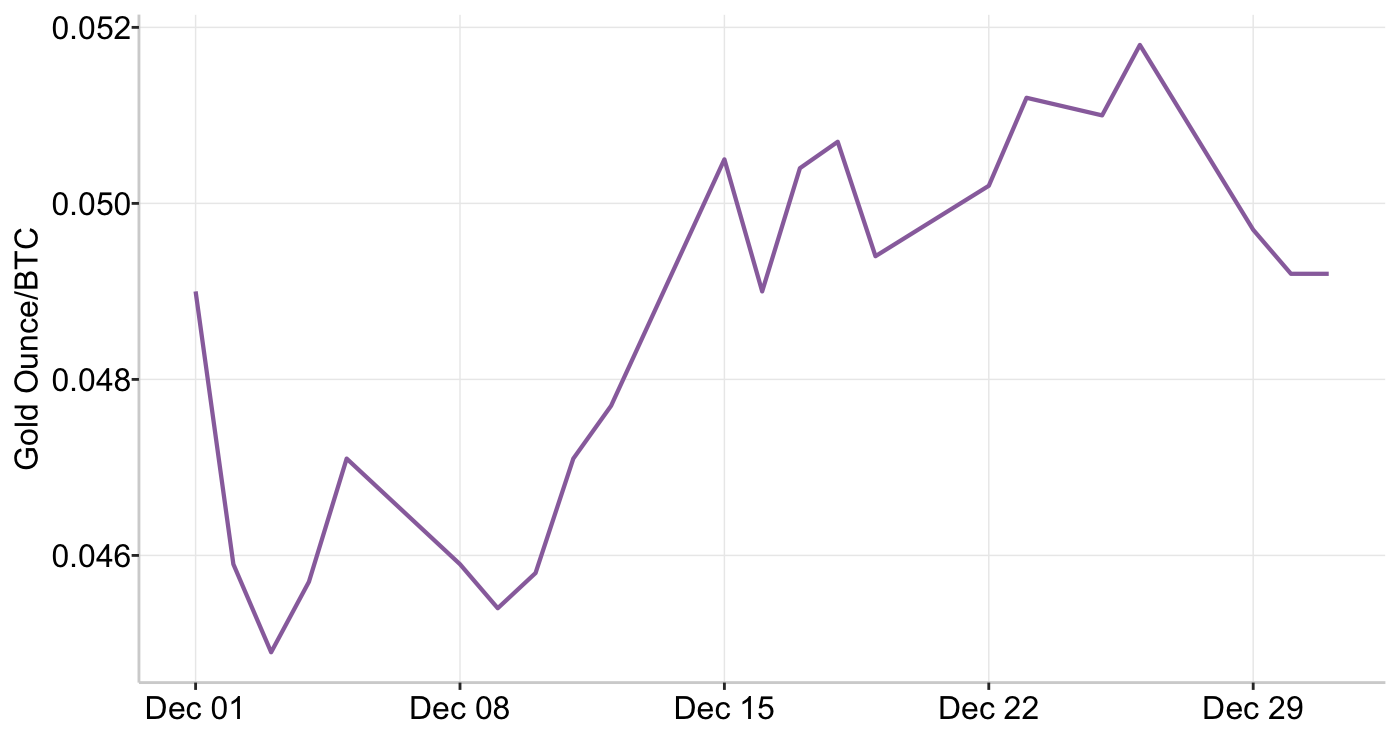
The Gold-to-Bitcoin ratio measures how many ounces of gold are required to purchase one Bitcoin, offering a relative comparison between a traditional store of value and a crypto-native risk asset. An upward trend in this ratio indicates that gold is outperforming Bitcoin.
Graph 8: Gold Ounce/BTC
Source: Kofin
Over the period shown, the ratio declines early in the month before trending steadily higher to reach 0.0518, then easing toward the end of the month. The rise suggests a shift in market preference toward hard assets, reflecting a more defensive and risk-aware investor stance rather than speculative risk-taking. This dynamic slightly reverses towards the end of the month, indicating a modest return to risk appetite.
Table 6: Market Capitalization of Tokenized Gold
| Market Capitalization | ||
|---|---|---|
| Tokenized Gold | January 2025 | December 2025 |
| RAAC PMUSD | Not in Market | $9,033,466 |
| Ethereum XAUT | $511,729,208 | $1,822,276,858 |
| Ethereum PAXG | $523,654,664 | $1,607,646,701 |
| Ethereum XAUm | $2,246,082 | $28,817,219 |
Source: rwa.xyz, Coinecko
Tokenized commodities ended the year with a market capitalization of $4 billion, having grown substantially since the start of the year, with the most pronounced expansions occurring in July and October 2025. Tokenized gold represents the majority of this market capitalization, with the Ethereum network led by XAUT at $1.82 billion. The growth of the tokenized gold market in 2025 reflects both strong sector profitability and robust demand for RWA-backed assets.
Moreover, an internal RAAC report analyzing gold prices through VaR and CVaR using GLD ETF data from 2005–2025 indicates that gold exhibits limited tail risk. At the 0.1% confidence level, the 1-day CVaR is approximately −6.8%, suggesting that a collateral ratio of 1.11 (90% LTV) provides adequate protection for gold-backed positions with daily liquidation capability. These findings reinforce gold’s suitability as collateral within RAAC’s lending framework.
For RAAC, the rising strength of gold supports the adoption of commodities as stable collateral and reinforces the sustainability of yields generated through RWAf(x). In the current macro environment, RAAC’s model benefits from heightened confidence in RWA-backed lending, positioning the protocol as a safer, more institutionally aligned alternative within DeFi.
Resources
Data
https://tradingeconomics.com/indicators
https://truflation.com/marketplace/us-inflation-rate
https://fred.stlouisfed.org/series/PRIME
https://fred.stlouisfed.org/series/MORTGAGE30US
https://app.koyfin.com/gyld
https://fred.stlouisfed.org/series/DGS10
https://fred.stlouisfed.org/series/BAMLC0A0CM#
https://fred.stlouisfed.org/series/WM2NS
https://fred.stlouisfed.org/series/VIXCLS
https://finviz.com/crypto_charts.ashx?t=ETHUSD&p=d
https://finviz.com/crypto_charts.ashx?t=BTCUSD&r=m1&ty=l&ta=0&p=d
https://defillama.com/stablecoins
https://www.coingecko.com/en/coins/curve-dao-token
https://defillama.com/protocol/yields/uniswap
https://defillama.com/protocol/yields/curve-finance
https://defillama.com/protocol/treasury/raac
https://www.coingecko.com/en/coins/convex-finance
https://defillama.com/protocol/convex-finance
https://www.cboe.com/us/indices/dashboard/ovx-GVZ/
https://app.koyfin.com/charts/g/fx-faleqt
https://app.koyfin.com/charts/g/fx-32ha89
https://app.koyfin.com/charts/g/ft-gt3aj0
https://www.cboe.com/us/indices/dashboard/ovx/
https://app.rwa.xyz/commodities
News
https://www.federalreserve.gov/monetarypolicy.htm
https://www.bloomberg.com/news/articles/2025-12-10/fed-cuts-rates-with-three-dissents-projects-one-cut-in-2026
https://www.bloomberg.com/news/articles/2025-12-11/us-mortgage-rates-tick-higher-sending-30-year-loans-to-6-22
https://www.bloomberg.com/news/articles/2025-11-30/to-bond-investors-some-emerging-markets-look-safer-than-the-us
https://www.bloomberg.com/news/articles/2025-12-10/-disappointment-trade-propels-global-bond-yields-to-2009-levels
https://www.bloomberg.com/news/articles/2025-12-10/the-great-income-squeeze-begins-as-fed-spells-end-to-easy-yields?itm_source=record&itm_campaign=The_Fed&itm_content=End_to_Easy_Yields-3
https://www.bloomberg.com/news/articles/2025-09-18/us-corporate-bond-spreads-set-new-27-year-low-after-fed-rate-cut
https://www.bloomberg.com/news/articles/2025-12-13/corporate-bond-investors-party-as-hangover-looms-credit-weekly
https://www.bloomberg.com/news/articles/2025-12-17/us-stocks-waver-as-ai-weighs-on-sentiment-traders-parse-data
https://www.bloomberg.com/news/articles/2025-12-24/stocks-hold-near-record-after-jobless-claims-in-thin-trading
https://www.bloomberg.com/news/articles/2025-12-24/bitcoin-misses-out-on-wall-street-cheer-to-stall-near-87-000
https://ca.finance.yahoo.com/news/cryptocurrency-slump-erases-2025-financial-170040421.html
https://www.bloomberg.com/news/articles/2025-12-09/spot-silver-tops-record-60-as-traders-bet-on-lower-rates
https://www.bloomberg.com/news/articles/2025-12-09/treasuries-rally-stalls-on-job-openings-data-with-auction-ahead
https://www.bloomberg.com/news/articles/2025-12-28/silver-rises-to-record-above-80-in-historic-end-of-year-rally
https://www.marketpulse.com/markets/2026-fx-outlook-improved-global-growth-boosts-weaker-us-dollar-eur-aud-and-jpy-top-picks/