
Overview
The Federal Open Market Committee did not meet this month, leaving interest rates unchanged. Fourth-quarter GDP came in below expectations, while still-elevated inflation has reinforced a relatively hawkish tone from the Fed. U.S. Treasuries remain near three-month lows, and U.S. equities have been highly reactive to shifting AI-related sentiment. Meanwhile, the U.S. dollar remains weak relative to other G7 currencies.
Oil prices advanced amid renewed geopolitical tensions, despite earlier forecasts of excess supply. Gold and silver have rebounded following a sharp correction, supported by renewed flight-to-safety flows from investors.
The crypto market remains well below its October peak. Within stablecoins, Tether (USDT) continues to hold the largest market capitalization, though the broader stablecoin landscape is evolving. Borrowing rates on Ethereum suggest reduced leverage activity across the ecosystem. RAAC’s pmUSD is currently the 49th largest stablecoin and continues to offer competitive yield opportunities through its partnerships.
Macroeconomic & Traditional Finance Outlook
United States
The Federal Open Market Committee did not meet this month, leaving interest rates unchanged at 3.50%–3.75% following the prior meeting. Recent job data suggests the labour market is stabilizing and remains relatively tight. However, fourth-quarter GDP growth came in below expectations. While inflation readings were controlled and broadly in line with forecasts, they remain elevated and continue to represent the primary constraint facing the Fed.
Minutes from the Fed reflected a hawkish tone, with several officials indicating that rates may need to remain elevated if inflation proves persistent. Current market pricing implies roughly a 50% probability of a quarter-point rate cut by June, with two additional cuts expected by year-end. Expectations for further easing have faded.
Table 1: US Indicators
| Indicator | Period | Actual | Previous | Consensus |
|---|---|---|---|---|
| GDP | Q4 | 1.4% | 4.4% | 3.0% |
| Unemployment | Jan | 4.3% | 4.4% | 4.5% |
| Core CPI (YoY) | Jan | 2.4% | 2.7% | 2.5% |
| 1YR Inflation Expectations | Feb | 3.4% | 4% | 3.5% |
Source: tradingeconomics
Table 2: Alternative Inflation Metric: Truflation US CPI Inflation Index (YoY)
| Period | Highest | Lowest | Average |
|---|---|---|---|
| February | 1.49% | 0.68% | 0.94% |
| January | 1.95% | 1.18% | 1.58% |
Source: truflation
Notes: The Truflation CPI Index relies on current consumer and spending data to deliver daily inflation readings that better capture rapid economic changes overlooked by traditional inflation measures.
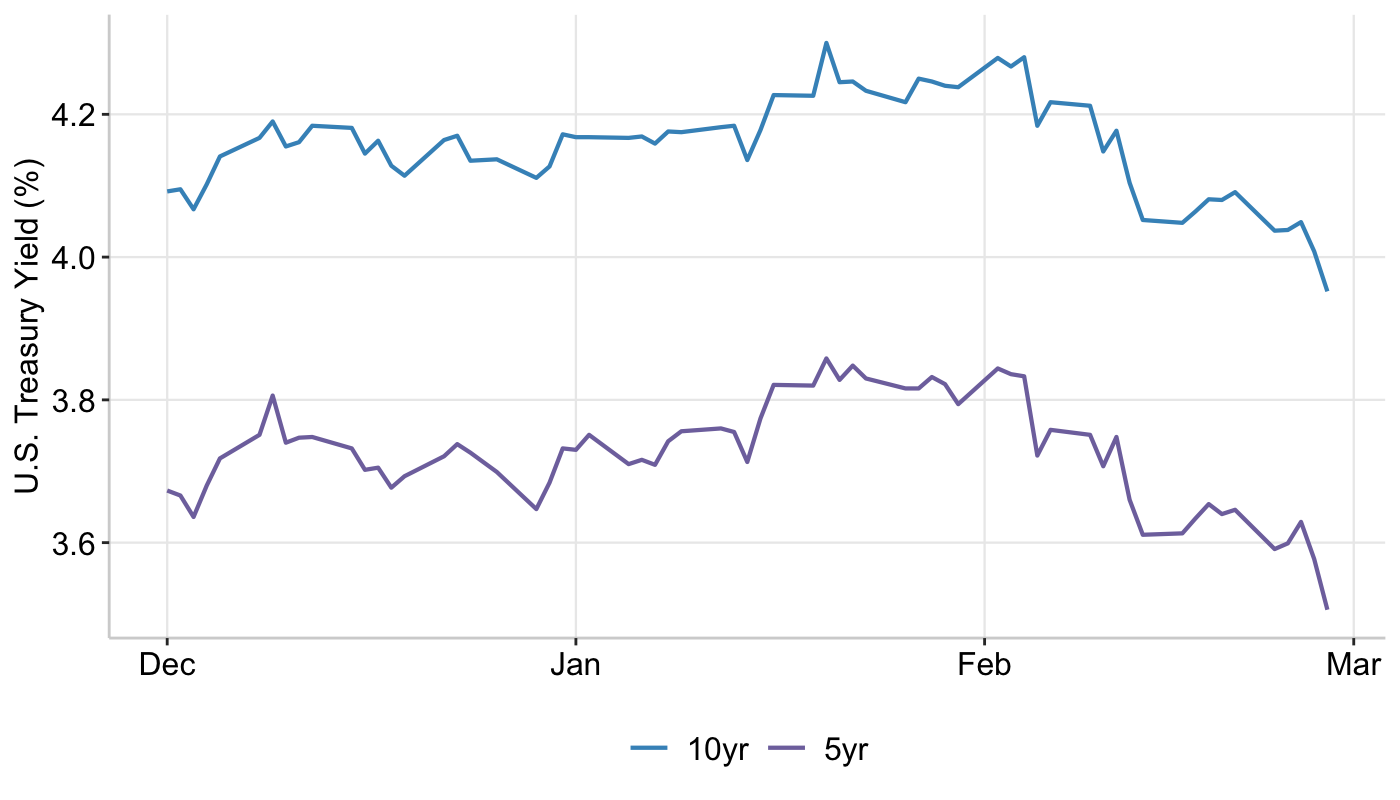
Over the past month, U.S. Treasuries have rallied due to concerns about AI-driven disruption, mixed U.S. economic data, and strength in Japanese government bonds.
Bonds initially moved higher as investors rotated into safe-haven assets amid uncertainty surrounding AI-driven disruptions, pushing the 10-year yield down to 4.10%. However, this move was later reversed as risk appetite improved, fueled by optimism around AI-related companies, which reduced demand for government bonds.
Graph 1: US 5 year & 10 year Bonds
Source: Koyfin
Treasuries also faced a third straight daily decline (yields rising), driven by oil-related inflation fears, a hawkish tone in recent minutes from the Federal Open Market Committee, and reduced confidence in near-term easing. Despite this pullback, yields remain near three-month lows. With the labour market stable, investors appear hesitant to push bond prices significantly higher without new catalysts.
Additionally, Chinese regulators have advised domestic banks to reduce their exposure to U.S. Treasuries due to concerns about concentration risk and market volatility. This news caused a modest decline in Treasuries and the U.S. dollar. However, foreign holdings of U.S. Treasuries remain at a record $9.4 trillion, highlighting continued global demand.
After reaching historical lows last month, credit spreads ended this month at 0.82, though they remain relatively tight. Investor demand for U.S. corporate bonds has surged, driving record secondary-market trading volumes of over $61 billion per day in January. While bond prices have risen, a strong appetite for yield, substantial tech-sector borrowing to finance AI investments, and increased M&A activity continue to fuel both issuance and turnover. However, portfolio managers are warning of growing dispersion within the credit market.
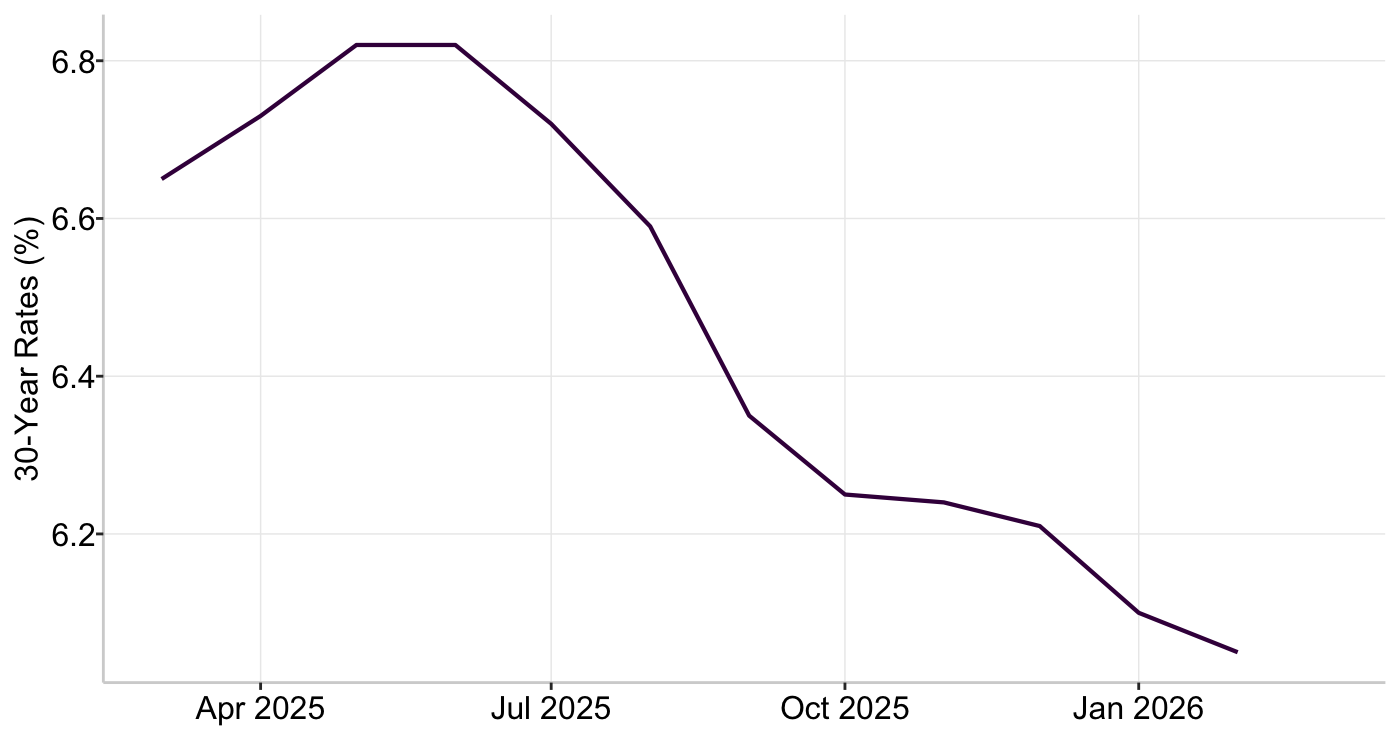
Graph 2: US 30-Year Mortgage Rates
Source: FRED
Mortgage rates have been trending lower heading into 2026 following three rate cuts by the Federal Open Market Committee in late 2025. Although the Fed has since paused further cuts, 30-year fixed mortgage rates remained relatively stable in February, ranging between 5.98% and 6.11%. Experts do not anticipate significant additional declines, with most forecasts projecting rates to remain in the 6%–7% range throughout 2026, and any further easing expected to be gradual.
Equities
U.S. stocks declined as investors retreated from risk amid rising Middle East tensions, renewed concerns about an AI bubble, and growing stress in private credit markets. The S&P 500 recorded its worst month since last March.
Software stocks are now down more than 25% from their October peak, as investors question whether AI could disrupt existing business models and valuations—even as many firms continue to post solid earnings growth. Earlier, AI was viewed as a margin- and productivity-enhancing force; however, sentiment has shifted, with advancing AI capabilities raising concerns about the long-term viability of certain incumbents.
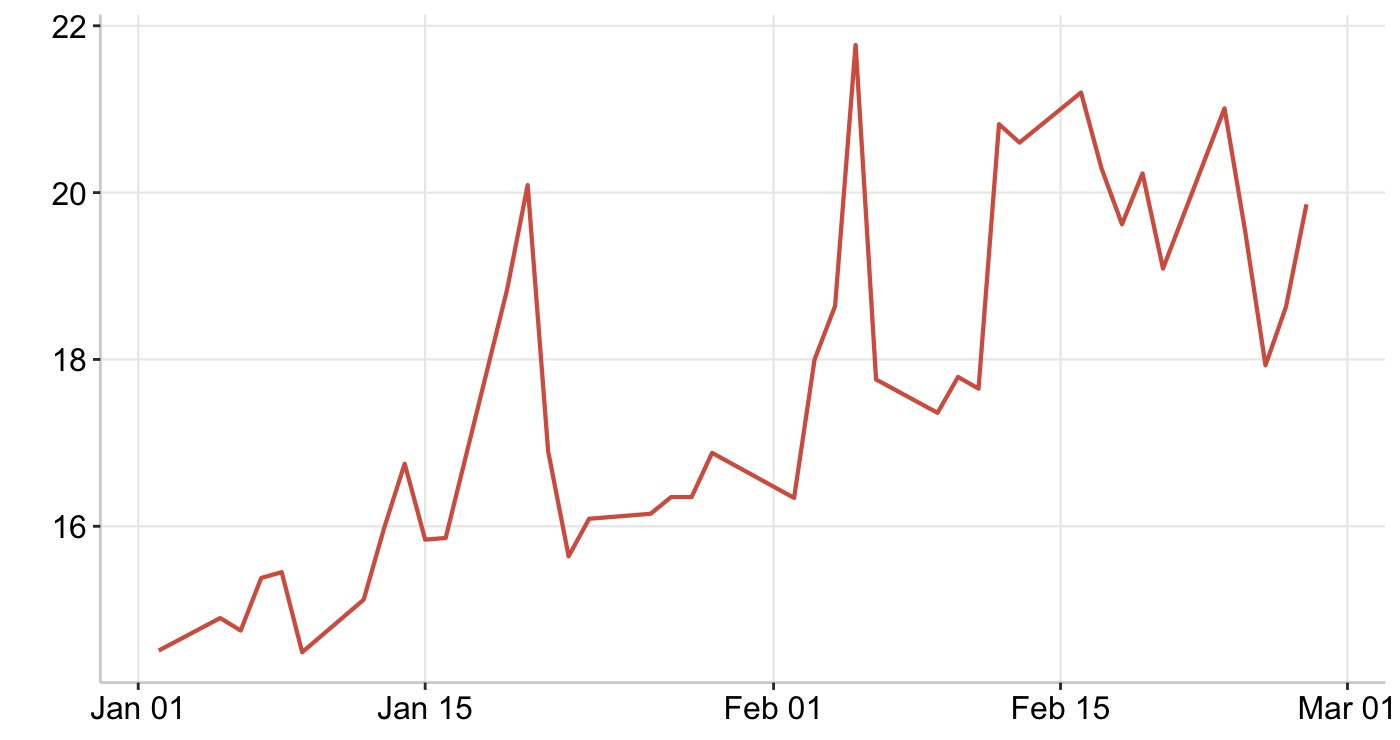
Mid-month, equities, crypto, and commodities sold off again as fears of AI-driven disruption resurfaced and rising technology costs added pressure to profit expectations. By month-end, however, stocks rebounded as investors reassessed the severity of AI-related risks. A two-day rally followed, led by technology shares. A strong forecast from Nvidia helped restore momentum to AI-linked stocks and reinforced the view among some investors that the long-term AI growth story remains intact despite recent volatility.
Graph 3: CBOE SPX Volatility Index
Source: FRED
Markets appear to be repricing the impact of AI through a technical reset rather than a fundamental one. Investors are rotating out of growth-oriented sectors and into hard assets, real-economy value plays, and more defensive positioning. While AI-related concerns remain, they are moderating as markets work to distinguish potential winners from losers.
World Currencies
The U.S. dollar strengthened briefly this month, supported by higher Treasury yields, geopolitical tensions, firm U.S. economic data, and expectations that rate cuts may be delayed. However, despite this rebound, broader sentiment toward the dollar remains bearish, as its overall monthly performance is still weaker relative to other developed-market currencies.
Table 3: World Currencies Performance (Month-to-Date)
| USD | EUR | GBP | JPY | CAD | |
|---|---|---|---|---|---|
| USD | 0.4% | 1.6% | 0.9% | 0.2% | |
| EUR | -0.4% | 1.2% | 0.6% | -0.1% | |
| GBP | -1.5% | -1.2% | -0.6% | -1.3% | |
| JPY | -0.9% | -0.6% | 0.6% | -0.7% | |
| CAD | -0.2% | 0.1% | 1.3% | 0.7% |
Source: Koyfin
Emerging-market currencies have shown comparatively greater stability, while developed-market currencies have experienced more turbulence. Uncertainty surrounding U.S. trade policy, fiscal concerns, and volatility in the yen have weighed on developed currencies. As a result, capital flows have increasingly favored emerging markets.
Real-World Assets
RAAC backs its financial products with real-world assets (RWAs), offering greater stability. The following section reviews the current market performance of each underlying asset.
Real Estate Environment
For homeowners, there are emerging signs of relief as mortgage rates continue to decline. While shelter inflation remains elevated, the pace of growth has slowed. Housing supply is gradually increasing, though limited inventory remains the primary driver of elevated home prices. Additionally, Fannie Mae and Freddie Mac plan to purchase $200 billion in mortgage-backed securities to support the housing market, a move that could place further downward pressure on mortgage rates.
Commodities overview
RAAC’s RWAf(x) protocol enables users to access exposure to tokenized real-world assets, including gold, silver, and energy commodities.
Early in the month, WTI crude oil recorded a second consecutive weekly decline to $62.14/bbl as geopolitical tensions eased. Expectations of potential production increases from OPEC+, combined with forecasts that global oil supply could exceed demand in 2026, placed downward pressure on prices. However, renewed geopolitical tensions involving Iran shifted sentiment later in the month, reducing risk appetite and pushing oil prices higher. Military actions toward Iran lifted prices to $67.22/bbl, the highest level in six months.
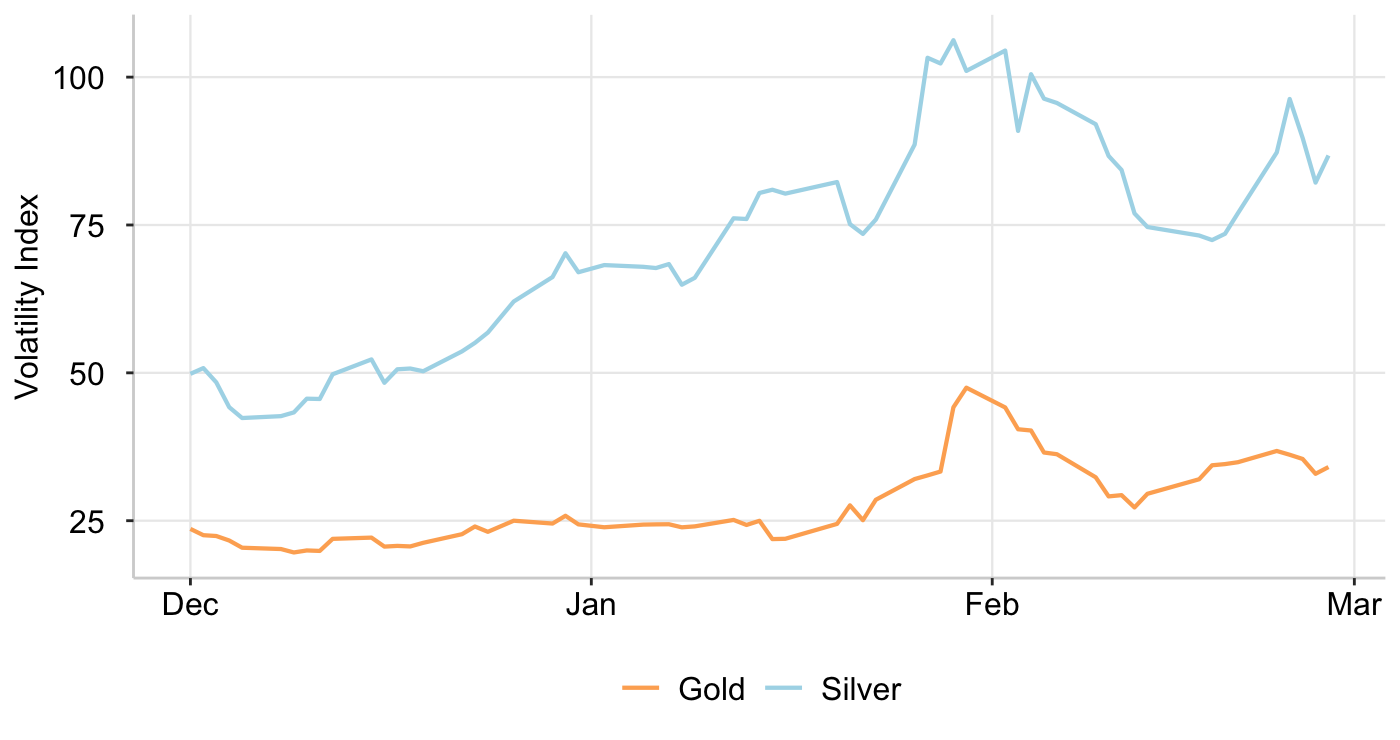
In January, gold and silver prices rallied to all-time highs before experiencing a collapse. The pullback appeared to be driven by heavy speculative positioning, heightened geopolitical fears, concerns surrounding the independence of the Federal Open Market Committee, and overcrowded positioning with too many traders on the same side of the trade. This type of price action was not reflective of typical market behavior and was likely stress-driven. The decline resembled a “washout,” as leveraged traders exited positions, resulting in a cleaner market structure.
Following the selloff, both metals rebounded, reinforcing their longer-term structural investment case. Gold climbed back above $5,000 per ounce as investors sought safe-haven assets amid uncertainty surrounding new U.S. tariffs and escalating tensions in the Middle East. Geopolitical risks tied to Iran pushed gold to a monthly high of $5,279.57 per ounce and silver to $93.79 per ounce.
Graph 4: CBOE Gold/Silver ETF Volatility Index
Source: CBOE
However, gains may be limited by signals from the Federal Reserve System that interest rates are likely to remain elevated for an extended period, reducing the relative appeal of non-yielding assets. Gold and silver also declined during periods of broader risk-off sentiment tied to AI-related fears, demonstrating that even traditional safe-haven assets can come under pressure in volatile environments.
Volatility is expected to remain above historical norms, though not at extreme levels unless another speculative bubble forms. Elevated prices and volatility may lead investors to reduce position sizes, but they are unlikely to eliminate demand. Large price swings are likely to persist, making short-term trading riskier, while long-term holders may continue to benefit. Overall, gold and silver appear to be stabilizing after the sharp selloff, supported by ongoing macroeconomic uncertainty despite interest rate headwinds.
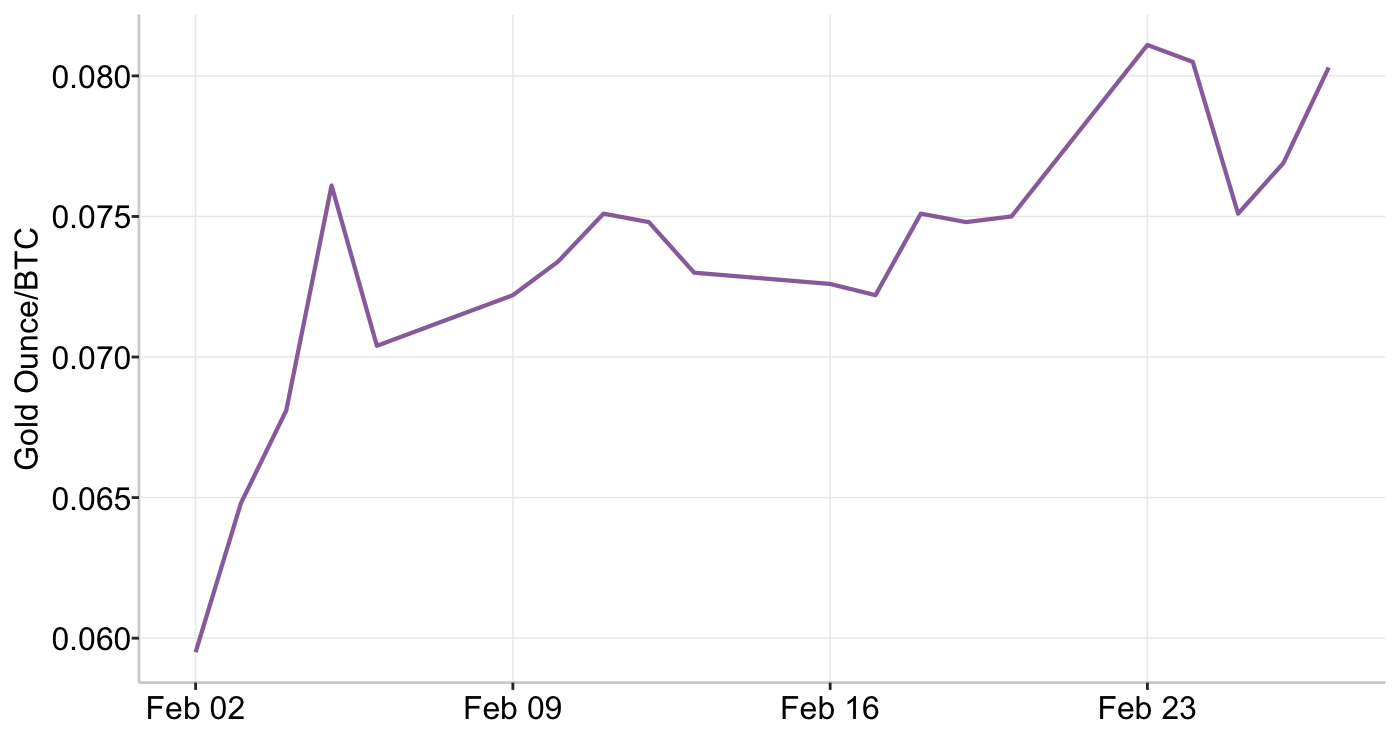
The gold-to-Bitcoin ratio indicates how many ounces of gold are needed to buy one Bitcoin, providing a comparison between a traditional store of value and a crypto-native risk asset. A rising ratio signals that gold is outperforming Bitcoin.
Graph 5: Gold Ounce/BTC
Source: Kofin
After an initial selloff in gold, the Gold/BTC ratio trended higher through February, indicating that gold outperformed Bitcoin over the period. This move is consistent with a broader rotation toward defensive assets amid heightened market volatility and geopolitical uncertainty.
Decentralized Finance (DeFi) Outlook
Cryptocurrencies
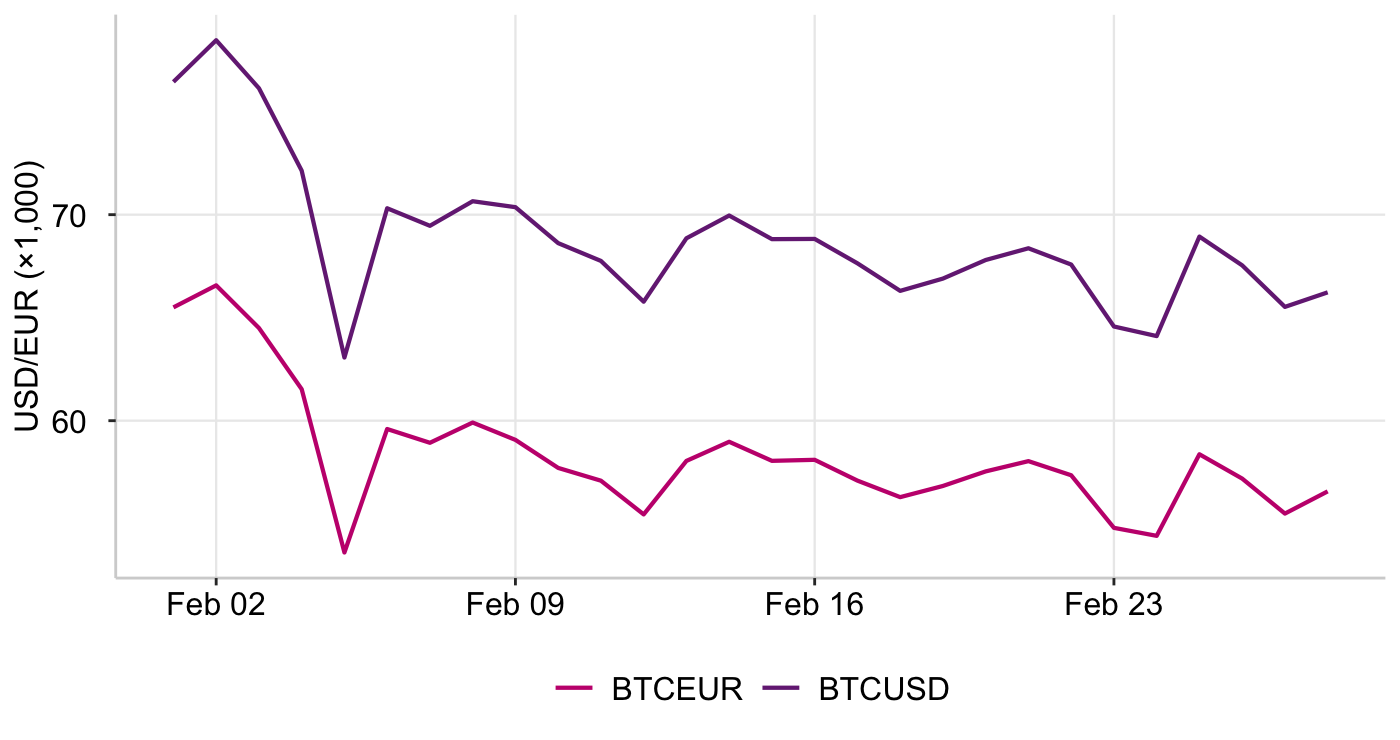
Early in the month, the crypto market experienced a sharp selloff, losing nearly $500 billion in total market value in under a week. Bitcoin (BTC) fell to a low of $63,067, extending its decline to roughly 50% from its October peak above $126,000. Unlike previous cycles marked by sharp crashes followed by aggressive dip-buying, this downturn has been more gradual and persistent. Rallies have struggled to gain traction, as investors who previously fueled the upside are now using rebounds as exit opportunities rather than initiating new positions.
Crypto supporters had expected stronger backing from the Trump administration and institutional investors; however, a key structural bill remains stalled in the Senate, and markets are beginning to realize that political support does not automatically translate into price protection.
Throughout the month, Bitcoin traded within a relatively tight range and continued to trade closely alongside software and technology equities. A selloff in tech stocks driven by renewed AI-related fears pushed Bitcoin back toward $65,000, erasing much of its move above $70,000. However, sentiment improved later in the month following a strong forecast from Nvidia, with Bitcoin rising 8% above $69,000 and Ether gaining 12% to $2,075.45.
Graph 6: Bitcoin vs USD/EUR
Source: Koyfin
Geopolitical developments also contributed to volatility. Bitcoin rebounded in early Asia trading after Iran confirmed that Supreme Leader Ali Khamenei had been killed during a military campaign involving the U.S. and Israel. Bitcoin rose as much as 2.21% to $68,196, while Ether gained over 4% to move back above $2,000. The broader crypto market recovered approximately $32 billion in value after shedding about $128 billion the previous day.
Meanwhile, Standard Chartered lowered its year-end 2026 Bitcoin price forecast to $100,000 (from $150,000). Overall, while crypto markets are attempting to find a base, near-term sentiment remains fragile.
Moreover, South Korean retail investors have been pulling back from crypto markets after repeated losses, with many reallocating capital toward equities and AI-related stocks. Despite this rotation, some market participants continue to believe that long-term blockchain adoption and stablecoin use cases could still expand, even if near-term price action remains volatile.
Stablecoins
Stablecoins are cryptocurrencies designed to maintain price stability. They are commonly held because they offer lower volatility than assets such as Bitcoin and Ethereum, allowing users to preserve capital while remaining active on-chain. RAAC issues its own stablecoin, precious-metal USD (pmUSD), which operates on the Ethereum blockchain.
Since the start of the year, stablecoin market capitalization has remained largely flat, showing limited expansion or contraction. The Ethereum network hosts approximately $159 billion in stablecoin supply, representing roughly 52% of the global market, and continues to serve as the dominant blockchain for stablecoin issuance and activity.
U.S. dollar–pegged stablecoins remain the most dominant within the ecosystem. Tether (USDT) holds the largest market capitalization at approximately $183 billion, while USD Coin (USDC) follows at around $73 billion. Additionally, crypto exchange Binance has integrated Ripple USD (RLUSD) with full support for the XRP Ledger, expanding access to regulated stablecoin offerings and increasing accessibility for investors.
Tether’s model of holding short-term U.S. Treasuries as backing assets has proven highly profitable. However, because users do not receive yield directly, this structure creates competitive pressure from alternative stablecoins that pass yield back to holders. Over time, this dynamic could reshape the competitive landscape of the stablecoin market.
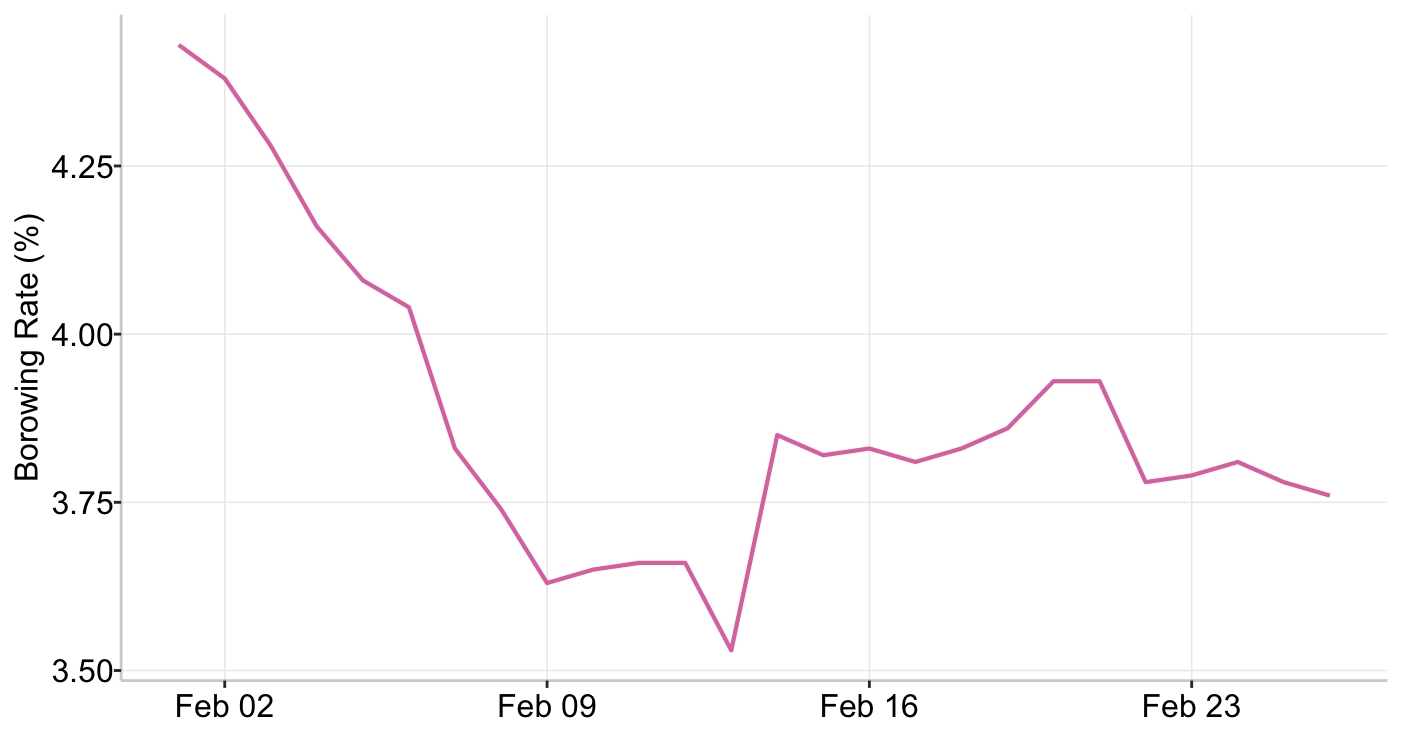
The Ethereum stablecoin borrowing rate represents the average cost of borrowing stablecoins across lending protocols on the Ethereum network.
Graph 7: Ethereum Stablecoin Borrowing Rate
Source: Blockworks
The Ethereum stablecoin borrowing rate trended lower through early February, declining from 4.43% to 3.53% before rebounding and stabilizing within a moderate range of approximately 3.75%–3.90% into the latter half of the month. The initial decrease indicates weaker borrowing demand and improving liquidity conditions across the Ethereum lending market, as greater available supply reduced utilization pressures. The stabilization suggests the market reached a new short-term equilibrium, with borrowing activity and liquidity provision balancing near optimal utilization levels. Overall, the movement implies reduced leverage activity and moderating yield opportunities relative to early February, consistent with a more cautious risk environment.
Glimpse into the Curve-Convex Ecosystems
RAAC is built directly within the Curve Finance (CRV) ecosystem and leverages Convex Finance (CVX) to enhance yield efficiency, strengthen governance influence, and direct liquidity toward its pools.
The Curve Wars refer to the competition to control voting power within Curve Finance. By locking CRV tokens, holders receive vote-escrowed CRV (veCRV), which grants voting rights to determine which liquidity pools receive reward emissions—ultimately influencing yield levels and liquidity depth. Protocols such as Convex have accumulated significant amounts of CRV and provide incentives to voters to allocate emissions toward their preferred pools.
Currently, Convex governs approximately 418 million veCRV, representing about 53% of the total voting supply. The following section provides a more detailed breakdown of Convex’s role and underlying mechanics within the Curve ecosystem.
Table 4: CVX Breakdown - January 31, 2026
| Assets locked in Convex forever | |||||
|---|---|---|---|---|---|
| Token | Locked | $/vlCVX | Price | ||
 CRV CRV |
422,350,505 | 2.23 | 0.25 | ||
 FXS FXS |
7,455,860 | 0.09 | 0.58 | ||
 FXN FXN |
140,462 | 0.05 | 16.33 | Emissions controlled by vlCVX | |
 RSUP RSUP |
3,551,225 | 0.01 | 0.16 | 2w Emissions | $/2w/vlCVX |
 veCRV veCRV |
--- | --- | --- | 2,381,043 | 0.0126 |
 vlCVX vlCVX |
47,765,228 | --- | 1.77 | --- | 0.0132 |
Source: buycvxcorrect.netlify.app
From the table above, it can be inferred that paying $1.77 for vlCVX provides voting power equivalent to $2.23 of CRV, making it a more capital-efficient method of accumulating liquidity influence. As a result, RAAC’s strategy focuses on controlling voting power through the acquisition of Convex Finance (CVX) rather than directly purchasing Curve Finance (CRV).
The Kingmaker Ratio is a RAAC-specific metric designed to evaluate whether acquiring CRV directly or accumulating vlCVX is the more efficient strategy for directing liquidity toward pmUSD on Curve. Using the locked balances and market prices of CRV and vlCVX shown in Table 4, the leverage earned per dollar can be calculated as:
Kingmaker Ratio = veCRV/$ via CRVveCRV/$ via CVX
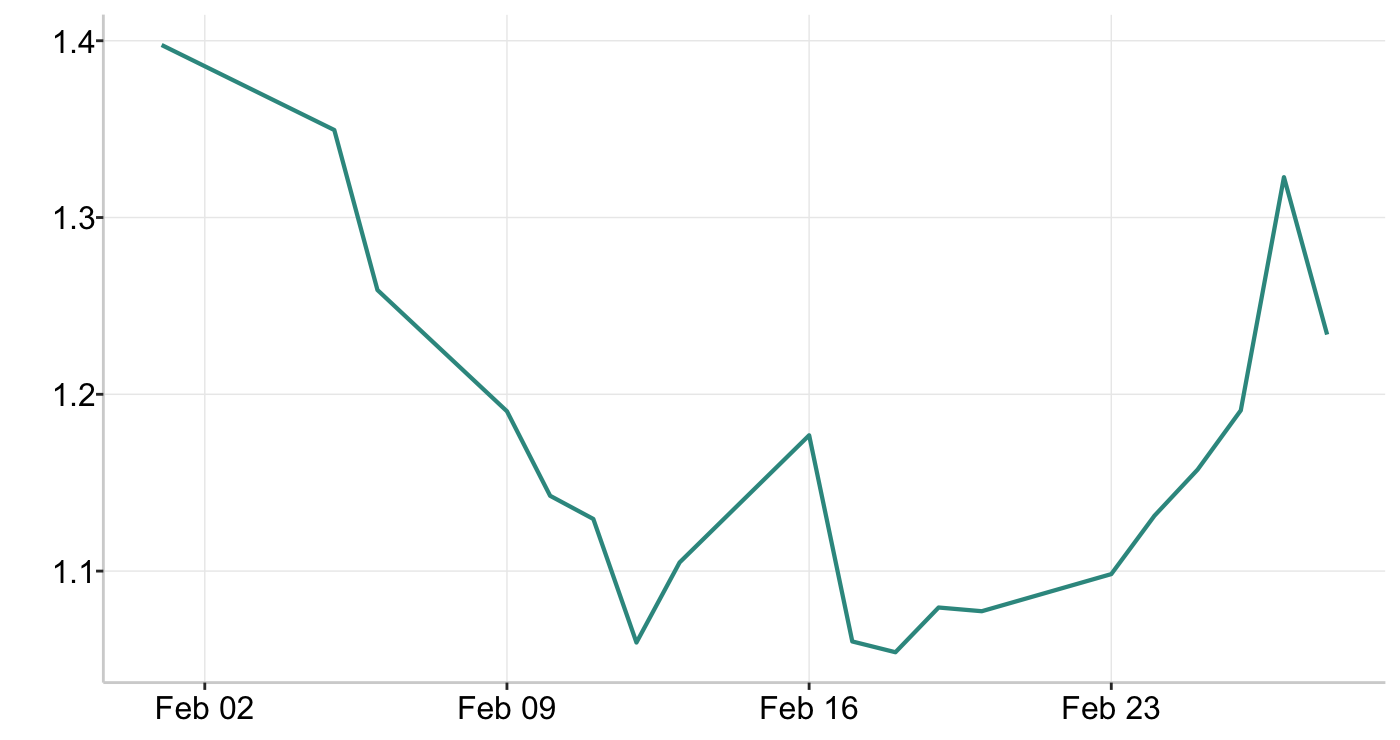
A ratio greater than one indicates superior capital efficiency through CVX, while a ratio below one suggests that direct CRV accumulation is more efficient. Graph 8 tracks the evolution of this ratio throughout the month of February.
Graph 8: Kingmaker Ratio
Source: buycvxcorrect.netlify.app
Graph 8 shows that the Kingmaker Ratio decreased in the beginning of the month, falling close to 1. This means Convex Finance remained slightly more capital efficient than direct CRV accumulation on Curve Finance throughout February. The narrowing gap reflects changing token prices with CVX rising and CRV softening which reduced, Convex’s relative efficiency advantage. However, toward the latter part of February, the ratio rebounded and moved higher again. This recovery suggests that Convex’s efficiency advantage strengthened into month-end, likely driven by relative price adjustments and shifting incentive dynamics. Overall, while the Kingmaker Ratio compressed significantly during early February, it did not breach 1, confirming that Convex maintained its structural edge across the period.
pmUSD
Precious-Metal USD (pmUSD) is RAAC’s stablecoin built on the Ethereum network. It officially launched at the beginning of 2026 and completed its first bond issuance on February 16, 2026, through a partnership with ApeBond. pmUSD is backed by gold assets supplied by RAAC’s partner I-ON Digital. The stablecoin is designed to provide a more stable alternative to volatile equities and mainstream cryptocurrencies, offering investors exposure to a gold-backed digital asset within the broader crypto ecosystem. The table below highlights monthly changes in market capitalization for RAAC’s pmUSD compared to other relevant stablecoins.
Table 5: 1 Month Market Capitalization Change (%)
| Stablecoin | Position | Market Cap. Change |
|---|---|---|
 pmUSD pmUSD |
49 | -1.26% |
 crvUSD crvUSD |
27 | -19.69% |
 frxUSD frxUSD |
44 | -10.78% |
 USDC USDC |
2 | +5.66% |
 USDT USDT |
1 | -1.28% |
 PYUSD PYUSD |
7 | 10.51% |
 fxUSD fxUSD |
109 | -55.59% |
Source: DefiLlama
Currently, pmUSD has a market capitalization of $109.48 million, ranking it as the 49th largest stablecoin. Over the month, its market capitalization declined by 1.26%, positioning it as relatively stable compared to other ecosystem-native stablecoins.
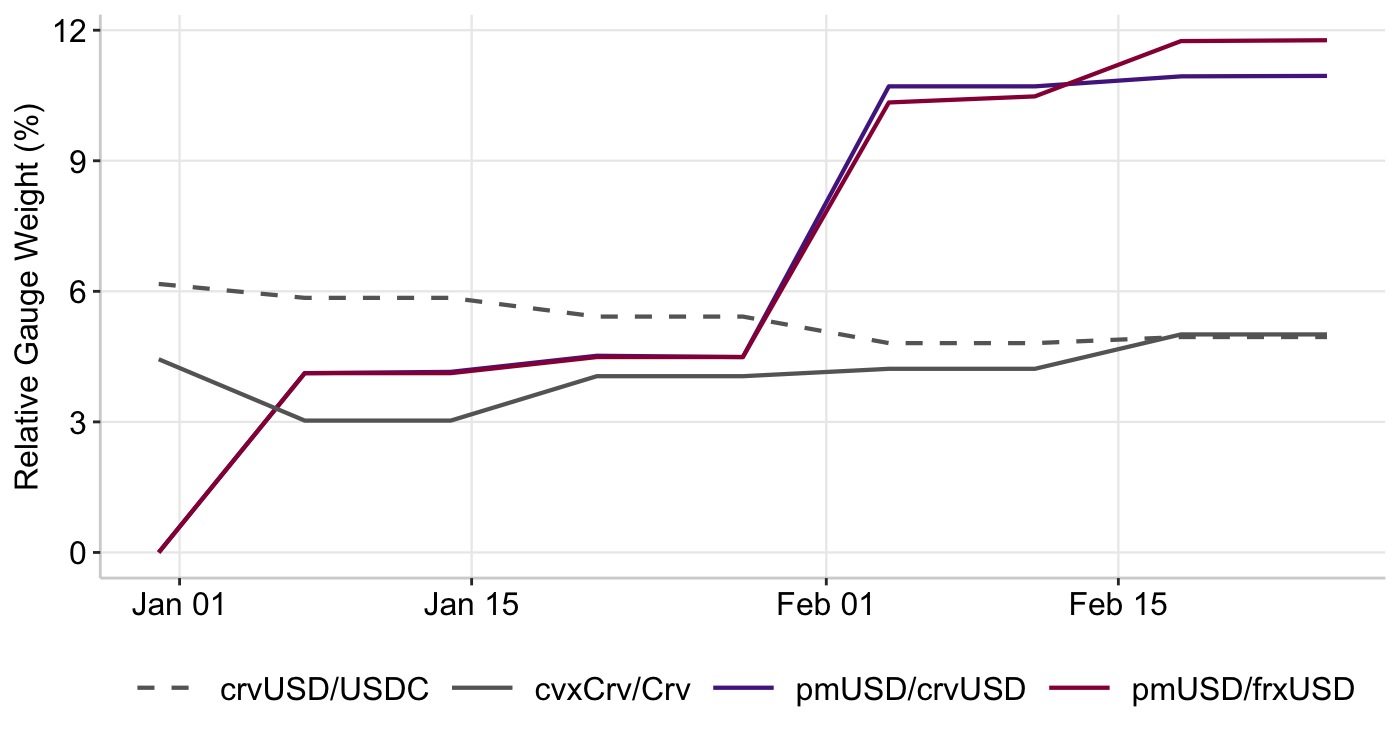
RAAC is built on the existing Curve Finance infrastructure and ecosystem, including active participation in the Curve Wars. Through this participation, RAAC has directed liquidity to its two Curve pools: pmUSD/crvUSD and pmUSD/frxUSD. Since launch, the pmUSD pools have captured a growing share of available emissions during each voting period.
Graph 9: Top Curve Gauges
Source: curve.finance
Graph 9 illustrates the relative gauge weight of the top four liquidity pools on Curve Finance. Currently, pmUSD/crvUSD holds 10.95% (242K CRV) of emission shares, while pmUSD/frxUSD holds 11.76% (260K CRV). RAAC’s two liquidity pools have consistently received the highest vote allocations in each new voting period relative to competing pools, signaling growing market confidence in the product.
The pmUSD pools offer participants competitive yields. Combined, the two Curve pools maintain approximately $30 million in total value locked (TVL), reflecting solid liquidity depth. As of February 28, 2026, pmUSD/crvUSD offers a base vAPY of 0.36% with reward tAPR ranging from 9.46% to 23.65% in CRV. Similarly, pmUSD/frxUSD provides a base vAPY of 0.60% with reward tAPR between 9.79% and 24.46% in CRV.
In addition, participants can further enhance their yields by depositing LP tokens into protocols such as Stake DAO, Convex Finance, Beefy Finance, and Yearn Finance to access boosted rewards. Table 6 provides a detailed breakdown of the available yield opportunities.
Table 6: Boosted Yields Opportunities for pmUSD
| Protocol | Pool Yields | |
|---|---|---|
  pmUSD/crvUSD pmUSD/crvUSD |
  pmUSD/frxUSD pmUSD/frxUSD |
|
 Convex Convex |
19.12% (proj. 20.96%) | 17.33% (proj. 18.83%) |
 Stake DAO Stake DAO |
15.61% | 17.40% |
 Beefy Beefy |
15.19% | 17.08% |
 Yearn Yearn |
--- | 24.00% |
Source: curve.convexfinance, stakedao, app.beefy, yearn.fi
Notes: data is exported on the last day of the month.
RAAC has also partnered with Gearbox Protocol and Royco Protocol to further expand return opportunities for participants. Gearbox operates as a leverage marketplace, allowing users to deploy pmUSD in leveraged yield farming strategies. It currently offers rewards of 22.03% APR, with maximum leverage of up to 5x. Meanwhile, Royco functions as a borrowing and lending protocol, where the borrowing APY stands at 1.34% and the supply rate at 1.25%, providing additional flexibility for capital deployment within the ecosystem.
Tokenized Commodities
Tokenized gold commodities have expanded significantly over the past year due to rising gold prices and macro uncertainty. Tether Gold (XAUT) is leading issuance on the Ethereum network at approximately $2.95 billion, followed closely by PAXG at $2.4 billion.
Table 7: Market Capitalization of Tokenized Gold on Ethereum
| Tokenized Gold | February 2025 | February 2026 |
|---|---|---|
 XAUT XAUT |
$2,570,548,676 | $2,953,676,326 |
 PAXG PAXG |
$2,298,784,950 | $2,500,693,770 |
 XAUm XAUm |
$24,851,945 | $70,062,010 |
Source: rwa.xyz
Notes: data is exported on the last day of the month.
Additionally, XAUT became the first tokenized gold asset to be used to pay dividends by a publicly traded gold company. This milestone, alongside strong growth in issuance, reflects increasing demand for blockchain-based real-world assets (RWAs) and reinforces the structural opportunity for RAAC to introduce its own gold-backed token.
Resources
Data
https://tradingeconomics.com/indicators
https://truflation.com/marketplace/us-inflation-rate
https://fred.stlouisfed.org/series/PRIME
https://fred.stlouisfed.org/series/MORTGAGE30US
https://app.koyfin.com/gyld
https://fred.stlouisfed.org/series/DGS10
https://fred.stlouisfed.org/series/BAMLC0A0CM#
https://fred.stlouisfed.org/series/WM2NS
https://fred.stlouisfed.org/series/VIXCLS
https://finviz.com/crypto_charts.ashx?t=ETHUSD&p=d
https://finviz.com/crypto_charts.ashx?t=BTCUSD&r=m1&ty=l&ta=0&p=d
https://defillama.com/stablecoins
https://www.coingecko.com/en/coins/curve-dao-token
https://defillama.com/protocol/yields/uniswap
https://defillama.com/protocol/yields/curve-finance
https://defillama.com/protocol/treasury/raac
https://www.coingecko.com/en/coins/convex-finance
https://defillama.com/protocol/convex-finance
https://www.cboe.com/us/indices/dashboard/ovx-GVZ/
https://app.koyfin.com/charts/g/fx-faleqt
https://app.koyfin.com/charts/g/fx-32ha89
https://app.koyfin.com/charts/g/ft-gt3aj0
https://www.cboe.com/us/indices/dashboard/ovx/
https://app.rwa.xyz/commodities
https://www.convexfinance.com/
https://www.curve.finance/dao/ethereum/gauges
https://www.curve.finance/dex/ethereum/pools?search=pmusd
https://www.stakedao.org/yield?search=pmusd
https://curve.convexfinance.com/stake
https://app.beefy.com/
https://yearn.fi/vaults?type=lp&search=pmusd
https://app.gearbox.finance/strategies/open/1/0x1774a6b4aba3b999461a1682f6776cac66dd1987
https://app.morpho.org/ethereum/market/0x72cc79433e9f91c2a185422725510f4bdd19c9006010f464f851468b2371b756/srroyusdc-pmusd?tab=market#advanced
News
https://www.bloomberg.com/news/articles/2026-02-04/wall-street-s-rotation-into-value-has-a-dot-com-warning-to-it
https://www.bloomberg.com/news/articles/2026-02-04/trillion-dollar-tech-wipeout-ensnares-all-stocks-in-ai-s-path
https://www.bloomberg.com/news/articles/2026-02-05/ecb-holds-rates-as-euro-rally-and-tariffs-threaten-economy
https://www.bloomberg.com/news/articles/2026-02-03/gold-silver-volatility-to-persist-after-price-plunge-bofa-says
**https://www.bloomberg.com/news/features/2026-02-05/the-pessimist-s-guide-to-the-credit-boom
https://www.bloomberg.com/news/articles/2026-02-06/dollar-set-to-halt-three-week-drop-as-gold-rally-ends-yen-falls
https://www.bloomberg.com/news/articles/2026-02-07/trump-fueled-crypto-rally-s-end-sends-traders-hunting-new-savior
https://www.bloomberg.com/news/articles/2026-02-09/china-urges-banks-to-limit-holdings-of-us-treasuries-citing-market-volatility
https://www.forbes.com/advisor/mortgages/mortgage-interest-rates-forecast/
https://x.com/Cointelegraph/status/2018430934006071375
https://www.bloomberg.com/news/articles/2026-02-03/stock-market-today-dow-s-p-live-updates?srnd=homepage-canada
https://www.bloomberg.com/news/articles/2026-02-04/bitcoin-led-crypto-rout-erases-nearly-half-a-trillion-in-a-week
***https://www.bloomberg.com/news/articles/2026-02-11/south-koreans-bail-on-crypto-as-retail-traders-bemoan-losses
https://www.bloomberg.com/news/articles/2026-02-12/us-home-resales-fall-most-in-four-years-despite-lower-rates
https://www.coindesk.com/markets/2026/02/12/bitcoin-tumbles-back-near-last-week-s-lows-as-ai-fears-crush-tech-and-precious-metals-plunge
https://fxdailyreport.com/binance-expands-stablecoin-offerings-with-rlusd/
https://www.bloomberg.com/news/articles/2026-02-13/bitcoin-btc-under-pressure-in-asia-after-standard-chartered-warning
***https://www.theblock.co/post/389633/clock-is-ticking-crypto-bills-2026-fate-hinges-on-trump-stablecoin-yields
https://www.bloomberg.com/news/articles/2026-02-12/latest-oil-market-news-and-analysis-for-feb-13?srnd=phx-markets
https://www.bloomberg.com/news/articles/2026-02-12/stock-market-today-dow-s-p-live-updates-?srnd=phx-markets
https://www.bloomberg.com/news/articles/2026-02-10/-stock-market-today-dow-s-p-live-updates
https://www.bloomberg.com/news/articles/2026-02-12/gold-steadies-after-sharp-drop-sparked-by-wider-market-jitters
https://www.bloomberg.com/news/articles/2026-02-17/heavy-demand-for-corporate-bonds-creates-record-trading-volume
https://www.bloomberg.com/news/articles/2026-02-18/asian-stocks-to-climb-as-tech-lifts-us-equities-markets-wrap
https://www.bloomberg.com/news/articles/2026-02-17/stock-market-today-dow-s-p-live-updates-
https://www.bloomberg.com/news/articles/2026-02-18/gold-steadies-in-thin-trading-as-focus-turns-to-fed-rate-plans
https://www.bloomberg.com/news/articles/2026-02-19/stock-market-today-dow-s-p-live-updates
https://cryptorank.io/news/feed/5cd5a-ecb-leadership-change-policy-neutral-nomura
https://www.bloomberg.com/news/articles/2026-02-25/treasuries-head-for-biggest-drop-in-week-as-risk-appetite-jumps
https://www.bloomberg.com/news/articles/2026-02-24/stock-market-today-dow-s-p-live-updates-
https://www.bloomberg.com/news/articles/2026-02-25/treasuries-head-for-biggest-drop-in-week-as-risk-appetite-jumps
https://www.bloomberg.com/news/articles/2026-02-26/asian-stocks-to-ebb-as-nvidia-decline-dulls-mood-markets-wrap
https://www.bloomberg.com/news/articles/2026-02-15/carry-trade-commodities-make-em-currencies-more-stable-than-g-7