
Overview
Macroeconomic conditions point to a stabilizing U.S. labour market and moderating inflation pressures, leading the Federal Reserve to hold rates at its January meeting. At the same time, rising geopolitical tensions have revived the “Sell America” narrative, placing upward pressure on U.S. Treasury yields, increasing volatility in U.S. equity markets, and weakening the U.S. dollar against major currencies.
Bitcoin and Ethereum rebounded briefly on regulatory optimism but remain well below prior highs, underscoring persistent structural weakness in crypto risk assets. The market continues to confirm that accumulating Convex remains the most capital-efficient strategy for influencing Curve liquidity.
Demand for affordable housing remains strong, while gold and silver continued their rally as geopolitical uncertainty intensified. This environment reinforces RAAC’s RWA-based model by strengthening collateral durability. Overall, markets are shifting away from volatile crypto assets toward hard stores of value.
Macroeconomic & Traditional Finance Outlook
United States
The Federal Open Market Committee (FOMC) voted 10–2 to keep the federal funds rate unchanged at 3.50%–3.75%. Officials cited continued improvement in the economy, noting that the labour market has stabilized and long-term inflation expectations remain well anchored, despite elevated price pressures from tariffs.
Markets are pricing in two rate cuts later this year; however, the upcoming change in the Federal Reserve Chair in May is expected to influence the timing and direction of future rate decisions.
Table 1: US Indicators
| Indicator | Period | Actual | Previous | Consensus |
|---|---|---|---|---|
| GDP | Q3 | 4.4% | 3.8% | 3.3% |
| Unemployment | Dec | 4.4% | 4.5% | 4.5% |
| Core CPI YoY | Dec | 2.6% | 2.6% | 2.7% |
| 1YR Inflation Expectations | Jan | 4.0% | 4.2% | 4.2% |
Source: tradingeconomics
Notes: The unemployment rate declined to 4.4%, coming in lower than the previous month and signaling modest improvement in the previously weak labor market. Annual core consumer price inflation fell to its lowest level since March 2021. However, shelter inflation accelerated, rising to 3.2% after a 3.0% increase in the prior month. One-year inflation expectations were revised slightly lower to 4.0% in January 2026, down from an earlier estimate of 4.2% and marking the lowest level in a year.
Table 2: Alternative Inflation Metric: Truflation US CPI Inflation Index (YoY)
| Period | Highest | Lowest | Average |
|---|---|---|---|
| Jan | 1.95% | 1.18% | 1.58% |
| Dec | 2.70% | 1.99% | 2.43% |
Source: truflation
Notes: The Truflation CPI Index relies on current consumer and spending data to deliver daily inflation readings that better capture rapid economic changes overlooked by traditional inflation measures.
The Federal Reserve is facing the risk of potential criminal indictment following escalating disagreements with the White House over interest rate policy. This clash is unsettling markets, as central bank independence is essential for controlling inflation and anchoring expectations. As a result, the “Sell America” narrative is resurfacing, with global investors selling U.S. assets and reallocating towards alternatives such as gold, non-U.S. equities, and foreign currencies, reflecting a growing loss of confidence in U.S. policy credibility.
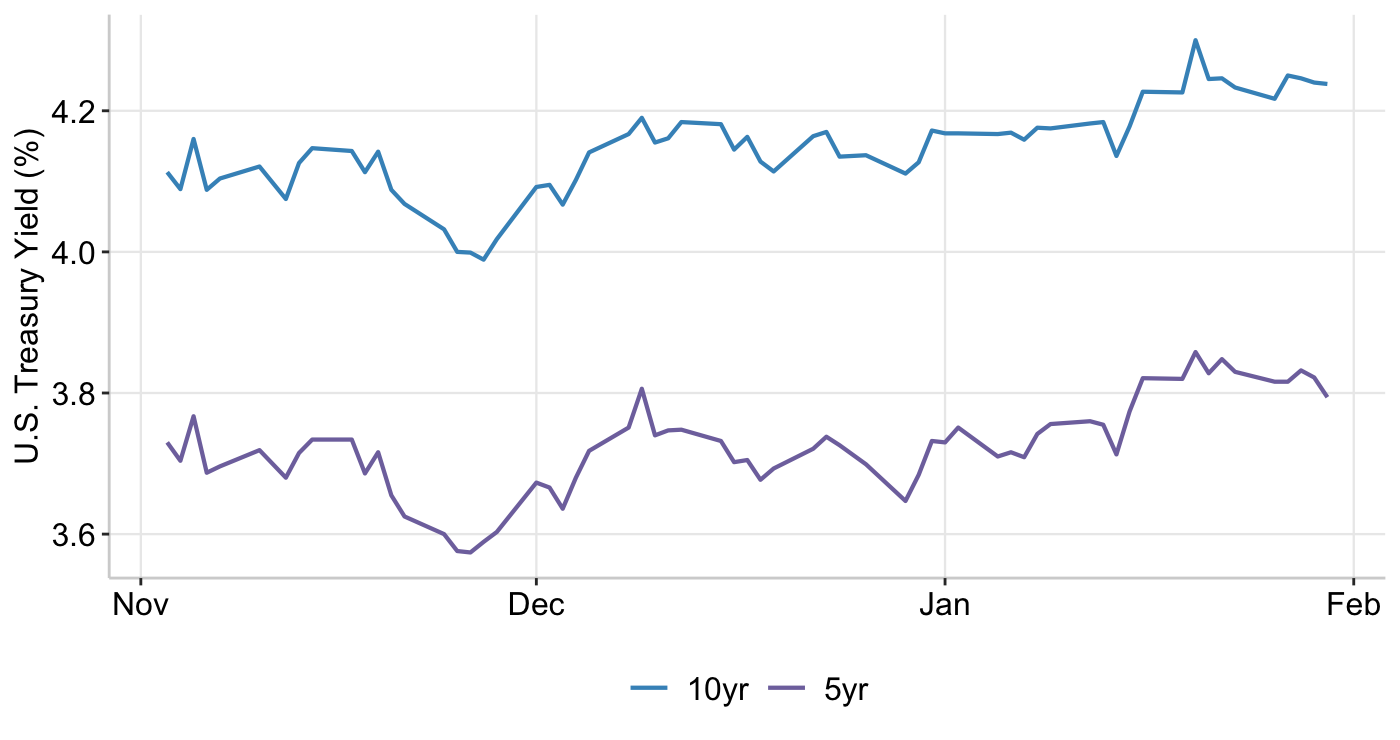
Geopolitical tensions are putting upward pressure on bond yields, as investors demand higher compensation to hold long-term debt amid rising risk. A sharp selloff in Japanese government bonds spilled over into global debt markets, with longer-dated maturities leading the losses. This caused the U.S. Treasury yields to move higher, with the 10-year rising seven basis points to 4.30%, its highest level since September 2025. The 5-year yield also climbed, reaching 3.86%. Overall, both tenors remained elevated throughout the month.
Graph 1: US 5 year & 10 year Bonds
Source: Koyfin
Credit spreads continue to tighten and are near historical lows at 0.74**.** Investor demand for corporate bonds remains strong, driven by the search for yield, and heavy issuance is being absorbed with ease. However, rising debt costs and higher leverage are pushing an increasing number of U.S. corporates from investment grade into high yield. Credit quality is deteriorating, and investors must be cautious about where their capital is allocated.
Money supply (M2) continued to expand this month, reaching approximately $22.7 trillion. While historical trends suggest that increasing liquidity can support higher demand for cryptocurrencies, current market conditions indicate a divergence from this relationship.
The prime lending rate remained unchanged at 6.75% throughout the month. The Trump administration has proposed a one-year cap on credit-card interest rates at 10% to reduce household borrowing costs and ease credit-card debt. While this may provide short-term relief, such a policy could reduce credit availability over the longer term, raise banking fees, and push consumers towards riskier forms of borrowing.
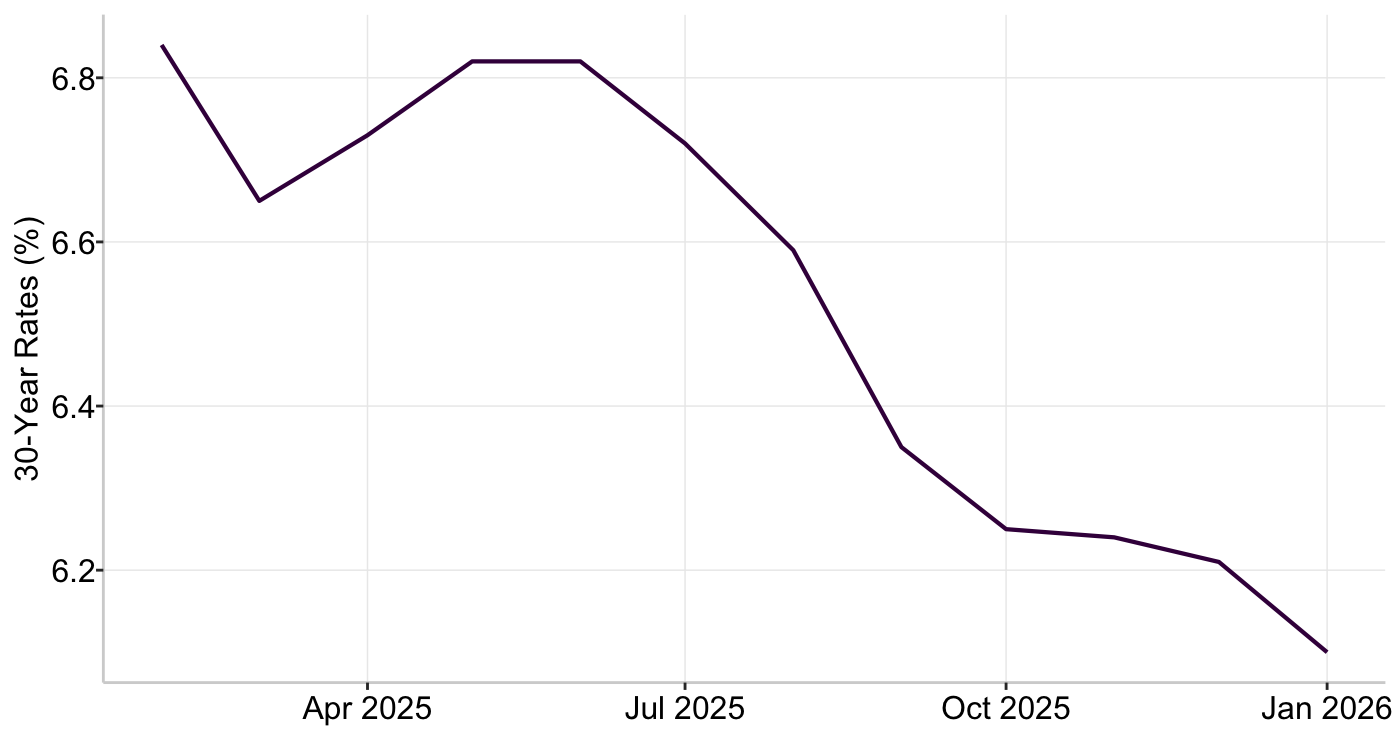
Graph 2: US 30-Year Mortgage Rates
Source: FRED
Mortgage rates declined to 6.06% before edging up slightly to 6.10%. This level has supported housing demand while encouraging homeowners to sell properties. While many had expected mortgage rates to gradually drift toward 6.5% in 2026, the Trump administration’s proposed purchase of $200 billion in mortgage-backed securities (MBS) could place renewed downward pressure on rates in an effort to improve housing affordability.
Equities
Markets began 2026 with a strong risk appetite, as investors rotated into more speculative assets on signs of improving economic momentum. However, ongoing geopolitical tensions quickly weighed on equities as the S&P 500 recorded its first two-week decline since June.
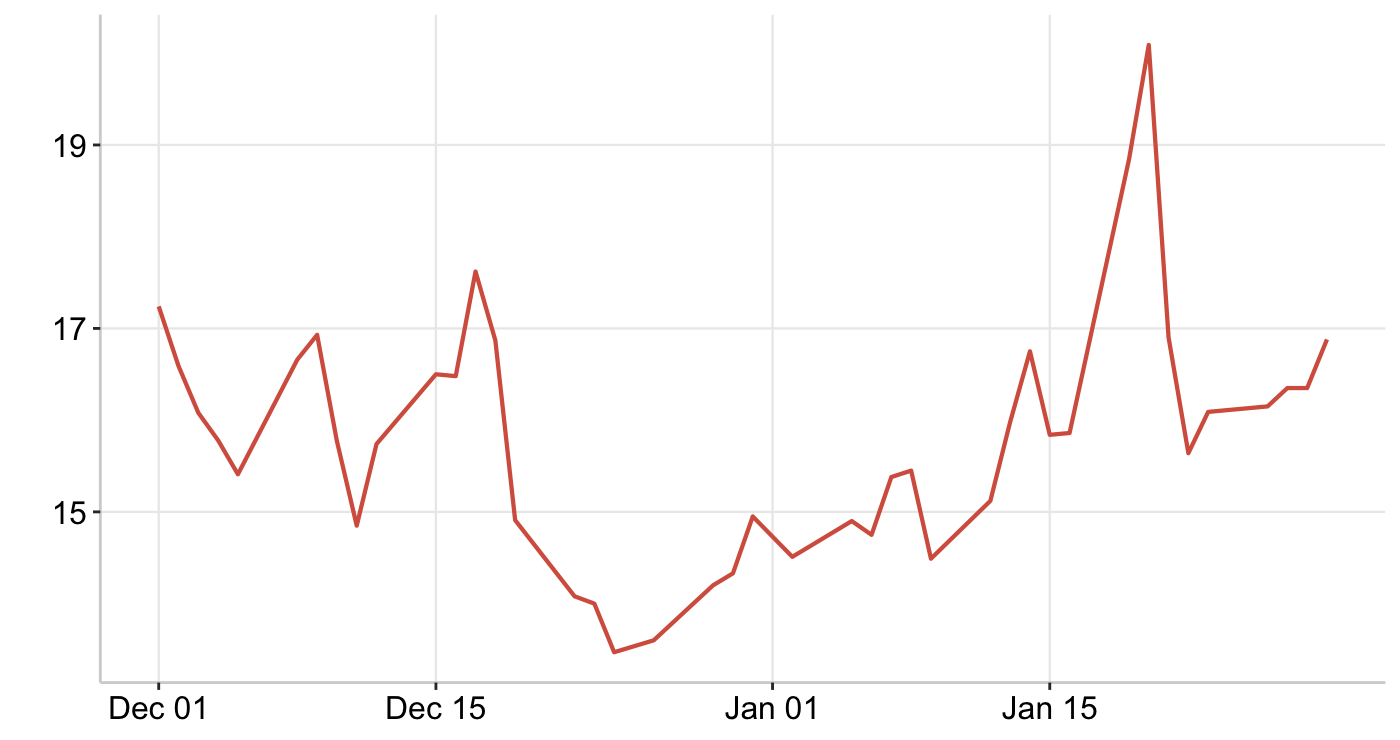
The Trump administration’s threats of new tariffs on several European countries, alongside renewed rhetoric around Greenland on January 20, erased the S&P 500’s early-year gains, leaving the index down 2.1%. This marked the worst single session since April 2025, when tariff-driven selloffs dominated markets. The Volatility Index (VIX) climbed to its highest level since November at 20.09.
Toward the end of the month, the S&P 500 briefly reached 7,000 USD for the first time in early morning trading, supported by semiconductor leaders reinforcing that AI demand remains resilient and that megacap technology continues to anchor earnings growth. However, the rally proved short-lived, with the index closing the month at 6,939.03.
Graph 3: CBOE SPX Volatility Index
Source: FRED
World Currencies
In January, the U.S. dollar depreciated against most major currencies as trade threats and weakening confidence in U.S. policy weighed on sentiment. Tensions between the United States and Europe supported gains in European currencies relative to the dollar. In Asian markets, the dollar fell to a four-month low amid speculation of coordinated U.S.–Japan foreign exchange intervention, which pushed the yen to a two-month high. Meanwhile, traditional safe-haven currencies such as the Swiss franc outperformed.
Table 3: World Currencies Performance (Month-to-Date)
| USD | EUR | GBP | JPY | CAD | |
|---|---|---|---|---|---|
| USD | -0.9% | -1.5% | -1.2% | -0.8% | |
| EUR | 0.9% | -0.7% | -0.3% | 0.1% | |
| GBP | 1.5% | 0.7% | 0.3% | 0.7% | |
| JPY | 1.2% | 0.3% | -0.3% | 0.4% | |
| CAD | 0.8% | -0.1% | -0.7% | -0.4% |
Source: Koyfin
As government policy uncertainty increases and the U.S. dollar weakens, investors are reallocating capital toward more stable opportunities outside U.S. assets. RAAC addresses this shift by offering an alternative investment approach through a gold-backed stablecoin, providing a resilient, capital-preserving option amid heightened market uncertainty.
Real-World Assets
RAAC backs its stablecoin with real-world assets (RWAs), offering greater stability than models that depend on volatile cryptocurrencies as collateral. The following section reviews the current market performance of each asset.
Real Estate Environment
Ahead of the midterm elections, President Trump has proposed banning institutional investors from purchasing single-family homes in an effort to improve housing affordability. However, many analysts are skeptical about the proposal’s effectiveness, noting that large institutions account for only about 2% of rental housing and that supply shortages remain the primary driver of high housing costs.
Commodity Overview
In January, WTI crude oil traded between a low of 55.99$/bbl and a high of 65.42$/bbl, remaining largely elevated above 59$/bbl throughout the month. Coming into 2026, many traders remain positioned for lower oil prices on expectations that global supply will outpace demand. However, escalating geopolitical tensions increased the perceived risk of a supply shock, prompting sharp price moves.
Gold and silver have continued their upward trend from last year as markets reprice geopolitical and policy risks, driving increased demand for precious metals through flight-to-safety behavior. Gold surged to a record high of $5,608.35 per ounce, and silver followed with a rally to $121.64 per ounce.
Gold prices surged in January, reaching new record highs with the strongest weekly gain since 2020. This move reflects a structural re-pricing of gold’s role within investment portfolios. While gold was previously viewed as an inflation hedge or a short-term crisis trade, gold is now being repositioned as a form of portfolio insurance. As U.S. Treasuries and the dollar have struggled to provide protection, investors are turning to gold as a non-sovereign store of value amid ongoing institutional uncertainty and geopolitical risks.
Silver also surged in January, driven by rising demand both as a safe-haven asset and as an industrial input for clean energy and electronics. Supply remains constrained, and with significantly smaller inventories than those of gold, demand shocks tend to amplify silver's price movements more quickly. As a result, silver has not merely followed gold higher but has reacted more forcefully to the same underlying drivers.
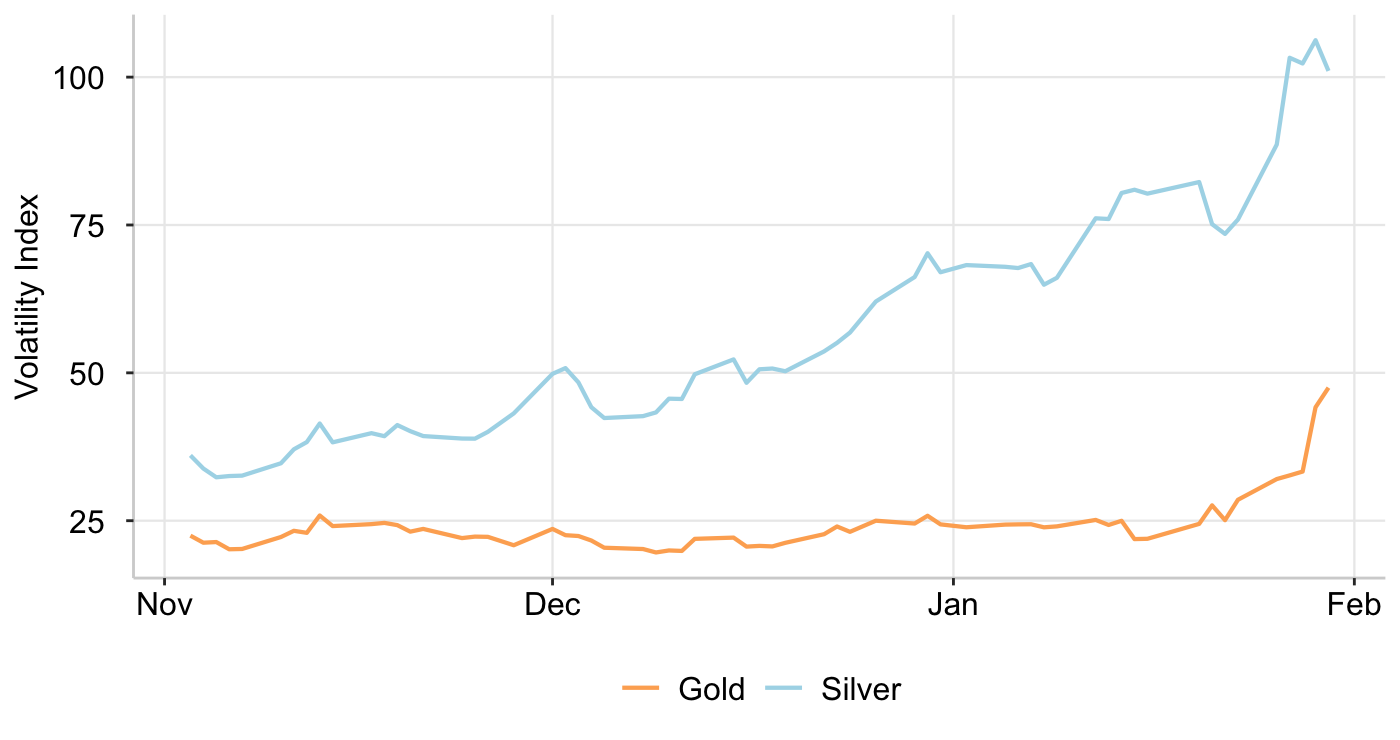
Graph 4 shows volatility levels for the two precious metals. Gold volatility remains relatively low and stable, fluctuating around the 20s until progressing higher towards the end of the month, which reinforces its role as a defensive and reliable store of value. In contrast, silver volatility rises sharply, climbing from the 70s to above 100, indicating higher uncertainty and sensitivity to developments.
Graph 4: CBOE Gold/Silver ETF Volatility Index
Source: CBOE
On January 30, gold fell more than 12% and silver plunged 36% as precious metals faced a sharp selloff following reports that the Trump administration was preparing to nominate Kevin Warsh as Federal Reserve chair. By the end of the session, both metals recovered a portion of their losses. Despite the pullback, gold still posted a monthly gain of 13% and silver rose 19%, signaling continued investor confidence in precious metals as flight-to-safety assets.
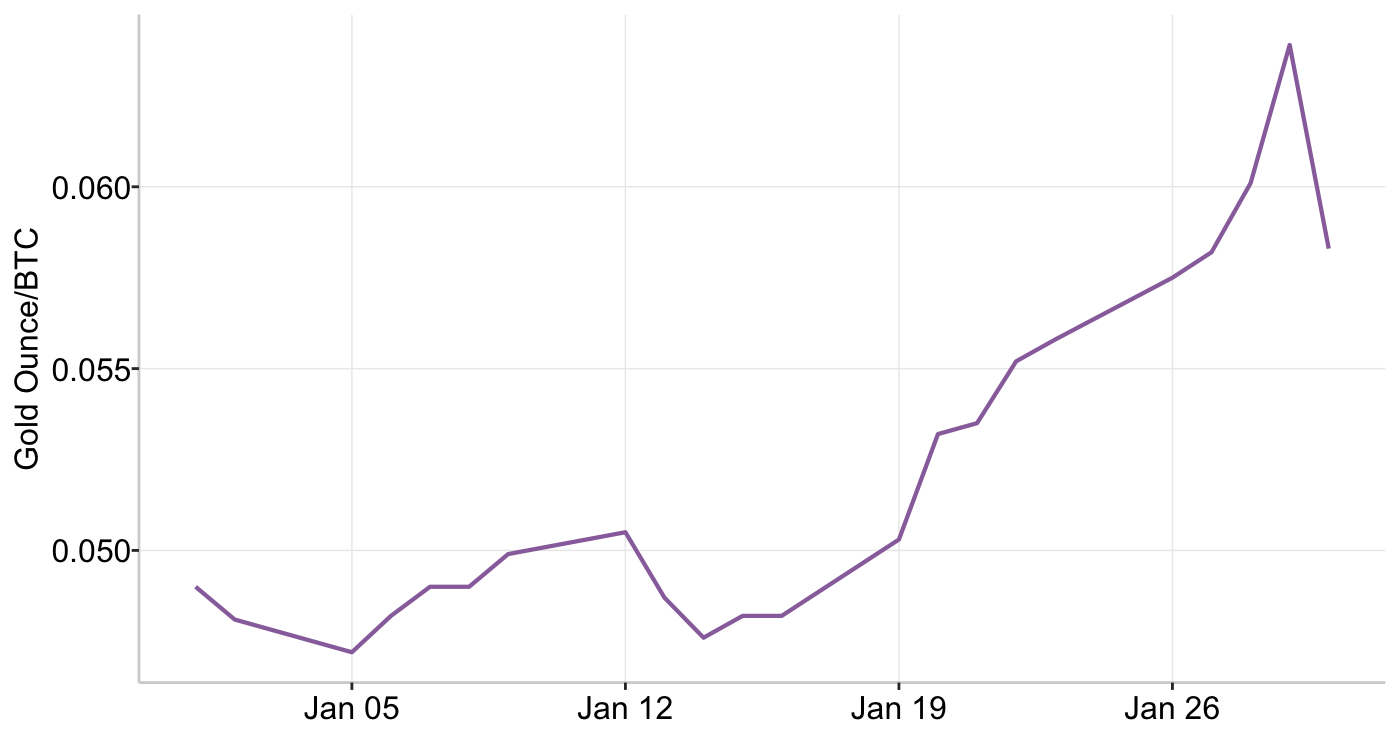
The gold-to-Bitcoin ratio indicates how many ounces of gold are needed to buy one Bitcoin, providing a comparison between a traditional store of value and a crypto-native risk asset. A rising ratio signals that gold is outperforming Bitcoin.
The gold-to-Bitcoin ratio trended higher throughout the month, reaching a peak of 0.063 before easing slightly. Temporary dips during the period suggest brief phases in which Bitcoin held up better than gold. By month-end, however, demand accelerated in favour of gold as ongoing geopolitical risks drove investors toward safer assets. This shift reinforces the appeal of gold-backed stablecoins, as capital rotates away from volatile crypto assets and towards real-asset stability.
Graph 5: Gold Ounce/BTC
Source: Kofin
The continued growth in precious metals and tokenized commodities supports strong demand for real-world assets amid ongoing global uncertainty and elevated volatility in assets such as Bitcoin. In this environment, RAAC is well positioned as a stable DeFi protocol, benefiting from investors’ increasing preference for stability and capital preservation over speculative risk.
Decentralized Finance Outlook
Cryptocurrencies
Crypto markets were largely range-bound in late 2025 following three consecutive months of declines. Although prices began to recover modestly at the start of the new year, renewed political uncertainty has triggered heightened volatility across the sector.
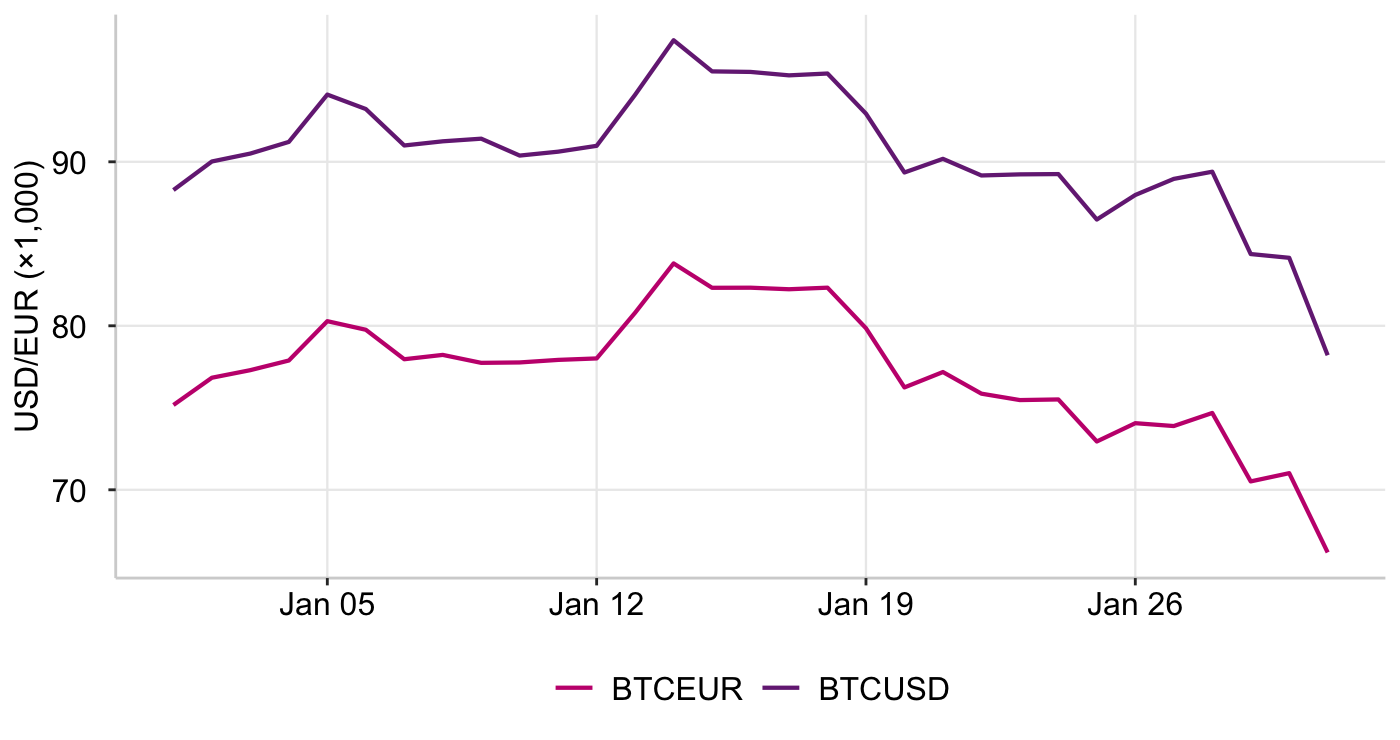
Bitcoin (BTC) climbed to a two-month high of $97,414 USD on optimism surrounding the proposed Digital Asset Market Clarity Act, which aims to establish a clearer regulatory framework for digital assets. Positive sentiment spread across the broader market, with Ethereum (ETH) gaining 5% to $3,323 USD. However, the timing of the legislation’s passage remains uncertain.
Graph 6: Bitcoin vs USD/EUR
Source: Koyfin
Despite this rebound, both Bitcoin and Ethereum remain well below their October 2025 record highs, highlighting ongoing structural weakness in crypto markets. During the month, Bitcoin experienced a week-long pullback, falling below $88,000 USD amid thin liquidity conditions and rising political risk in both the United States and Japan. At the end of the month, Bitcoin fell again to below $80,000 due to liquidity worries.
Bitcoin is often described as “digital gold,” with the expectation that it should appreciate during periods of heightened uncertainty. However, recent geopolitical tensions have challenged this narrative. While precious metals have rallied, Bitcoin has instead declined, suggesting that it functions like a risk asset rather than a true safe-haven.
Stablecoins
Stablecoins are cryptocurrencies designed to maintain price stability. They are commonly held because they offer lower volatility than assets such as Bitcoin and Ethereum, allowing users to preserve capital while remaining active on-chain. RAAC issues its own stablecoin, precious-metal USD (pmUSD), which operates on the Ethereum blockchain.
Stablecoin market capitalization remained largely flat throughout January, showing little growth or contraction. Ethereum hosts approximately $159 billion in stablecoin supply, representing about 52% of the global stablecoin market, and remains the dominant blockchain for stablecoin issuance and activity.
Stablecoin transaction volumes reached a record $33 trillion in 2025. Ethereum-based stablecoins led this growth, with USDC processing $18.3 trillion in transactions and USDT $13.3 trillion. This represented a 72% increase year over year and was driven in part by the U.S. government’s passage of the Genius Act, which provided clearer legal recognition for stablecoins and supported greater institutional adoption in payments and settlement infrastructure. As a result, stablecoins are increasingly transitioning from a crypto-native use case into mainstream financial infrastructure. Analysts project that transaction volumes could rise further, potentially reaching $56 trillion by 2030.
pmUSD directly benefits from the continued expansion of the on-chain dollar economy. As stablecoins become institutionalized across the financial system, RAAC’s pmUSD is well positioned to capture the sustained long-term demand and benefit from the next phase of market growth.
The table below highlights monthly changes in market capitalization for RAAC’s pmUSD relative to other relevant stablecoins. Changes in stablecoin supply offer insight into capital flows, investor positioning, and broader market sentiment.
Table 4: 1 Month Market Capitalization Change (%)
| Stablecoin | PMUSD | CRVUSD | USDC | FRXUSD | FXUSD | RLUSD | PYUSD |
|---|---|---|---|---|---|---|---|
| 1 M Change | +1,111% | -14.83% | -7.91% | -1.10% | -33.25% | +5.08% | +5.52% |
Source: DefiLlama
At the start of the month, RAAC entered the stablecoin market with our pmUSD bond offering to help expand the supply of pmUSD. RAAC’s RWf(x) issued $100 million of pmUSD supply, supported by $121.98 million in collateral. In addition, pmUSD liquidity pools have surpassed $18.0 million in total value locked (TVL). This rapid growth in both supply and collateralization supports strong initial demand and effective liquidity deployment. As a result, pmUSD now ranks as the 32th largest stablecoin on DeFiLlama, reflecting the successful execution of RAAC’s launch strategy. Overall, the table highlights selective capital allocation, with investors favoring stablecoin protocols that offer stronger utility, resilience, and structural advantages.
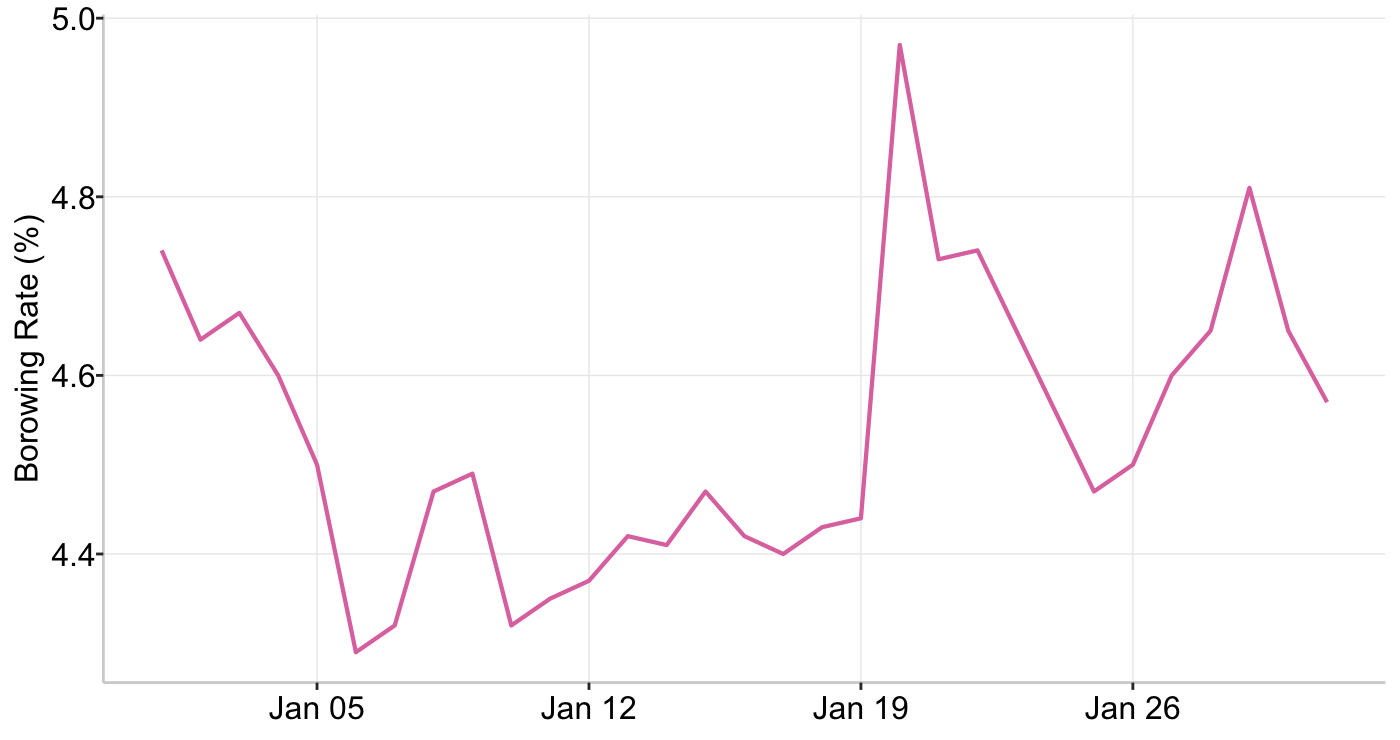
The Ethereum stablecoin borrowing rate represents the average cost of borrowing dollar-pegged stablecoins across lending protocols on the Ethereum network and serves as a benchmark for DeFi yield conditions.
Graph 7: Ethereum Stablecoin Borrowing Rate
Source: Blockworks
As shown above, borrowing rates exhibit short-term volatility but remain within a relatively stable range, fluctuating between approximately 4.3% and 5.0% over the period observed. While occasional spikes occur, they appear temporary and are quickly reversed. This indicates tactical shifts in liquidity and demand rather than fundamental changes in market structure. Overall, this pattern suggests continued subdued demand for leveraged borrowing and a broader shift toward a more risk-averse on-chain environment.
Glimpse into the Curve Ecosystem
RAAC is built directly within the Curve (CRV) ecosystem, using crvUSD as a core settlement and lending asset for pmUSD and RWA-backed lending pools. By operating natively on Curve and leveraging Convex (CVX), RAAC enhances yield efficiency and governance influence, enabling it to direct liquidity incentives toward its pools while minimizing long-term incentive costs.
Table 5: Protocols’ APY
| Average APY | ||
|---|---|---|
| Convex | Curve | |
| December 2025 | 7.70% | 4.73% |
| January 2026 | 6.74% | 4.73% |
Source: DeFiLlama
Notes: data is exported on the last day of the month.
The table above shows stable yields across both protocols from December 2025 to January 2026. For RAAC, this reinforces the benefits of being built within the Curve ecosystem. Curve-based yields are more predictable and governance-driven, which helps reduce volatility in liquidity pools. This structure allows RAAC to operate with lower incentive costs and reduces the risk of sudden capital flight.
Moreover, the relatively stable yield environment improves the efficiency of accumulating CRV or CVX, as the opportunity cost of holding governance tokens remains low when alternative yields are high. This dynamic aligns closely with RAAC’s RWA-backed model, where returns are designed to mirror risk-adjusted traditional financial assets rather than relying on short-term, incentive-driven crypto yields.
Convex controls the majority of Curve’s voting power and acts as a coordinator that directs Curve emissions toward selected liquidity pools. Currently, Convex governs approximately 418.2 million veCRV, representing about 53% of the total voting supply. The following section provides a more detailed breakdown of Convex’s role and mechanics.
Table 6: CVX Breakdown - January 31, 2026
| Assets locked in Convex forever | Emissions controlled by vlCVX | ||||
|---|---|---|---|---|---|
| Token | Locked | $/vlCVX | Price | ||
| CRV | 422,117,912 | $2.74 | $0.30 | ||
| FXS | 7,455,860 | $0.13 | $0.83 | ||
| FXN | 139,427 | $0.06 | $21.05 | ||
| RSUP | 3,551,225 | $0.02 | $0.27 | 2w Emissions | $/2w/vlCVX |
| veCRV | - | - | - | 2,372,934 | $0.0154 |
| vlCVX | 46,458,901 | - | $1.97 | - | $0.0162 |
Source: buycvxcorrect.netlify.app
From the table above, it can be inferred that paying $1.97 for vlCVX provides voting power equivalent to $2.74 of CRV, making it a capital-efficient way to accumulate liquidity influence.
RAAC tracks a metric known as the Kingmaker Ratio, which is used to assess whether acquiring CRV directly or accumulating CVX is the more capital-efficient strategy for directing liquidity toward pmUSD on Curve.
Using the locked values and market prices of CRV and CVX shown in the table, the leverage earned per dollar can be calculated as:
Kingmaker Ratio = veCRV/$ via CRVveCRV/$ via CVX
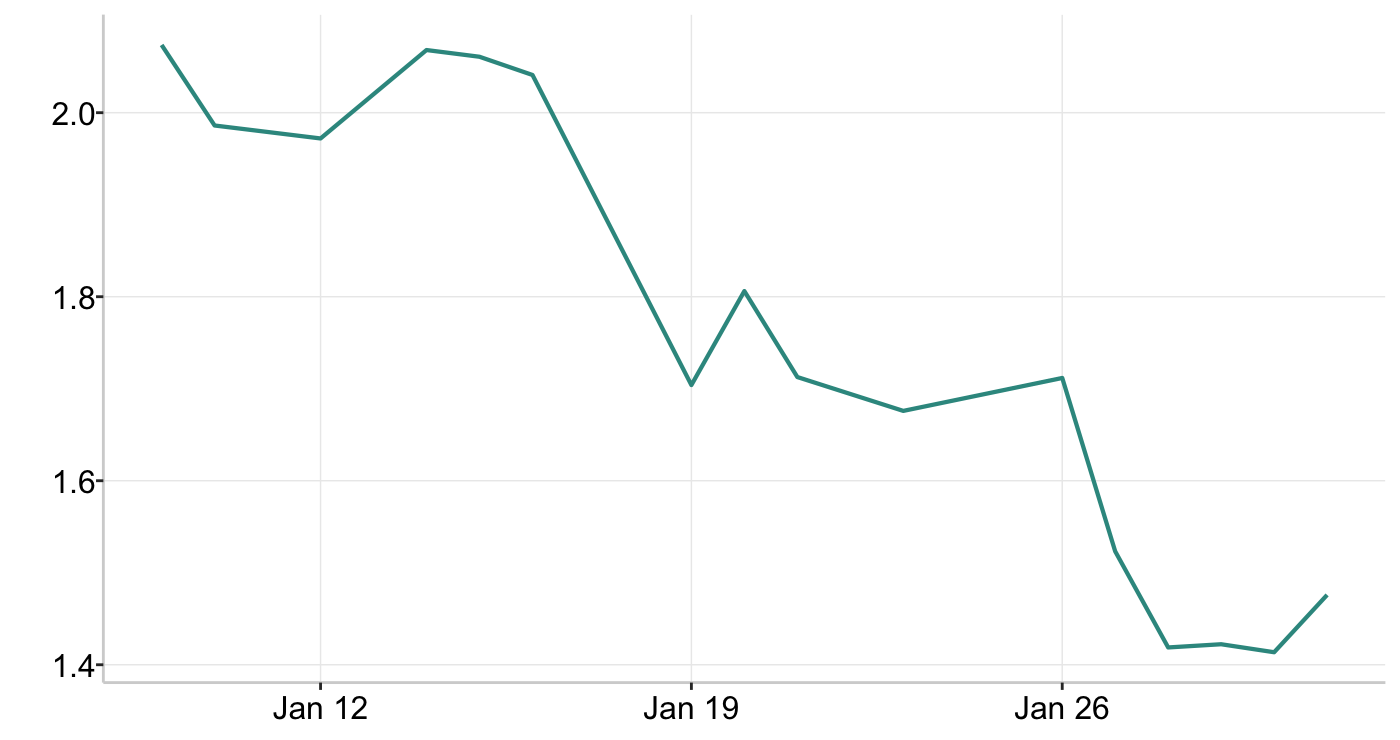
A ratio greater than one indicates greater capital efficiency through CVX, while a ratio below one suggests direct CRV accumulation is more efficient. Graph 6 tracks this ratio over the month of January.
Graph 8: Kingmaker Ratio
Source: coingecko
The KingMaker Ratio began the month near 2.0 but declined steadily to approximately 1.4 by month-end. This indicates that the relative voting power obtained through vlCVX per dollar decreased over the period. However, because the ratio remains above 1, accumulating vlCVX continues to be more capital-efficient than holding CRV directly. For RAAC, this confirms that vlCVX remains the preferred strategy for directing Curve liquidity toward pmUSD and reinforces Convex’s role as the dominant mechanism for liquidity control.
Resources
Data
https://tradingeconomics.com/indicators
https://truflation.com/marketplace/us-inflation-rate
https://fred.stlouisfed.org/series/PRIME
https://fred.stlouisfed.org/series/MORTGAGE30US
https://app.koyfin.com/gyld
https://fred.stlouisfed.org/series/DGS10
https://fred.stlouisfed.org/series/BAMLC0A0CM#
https://fred.stlouisfed.org/series/WM2NS
https://fred.stlouisfed.org/series/VIXCLS
https://finviz.com/crypto_charts.ashx?t=ETHUSD&p=d
https://finviz.com/crypto_charts.ashx?t=BTCUSD&r=m1&ty=l&ta=0&p=d
https://defillama.com/stablecoins
https://www.coingecko.com/en/coins/curve-dao-token
https://defillama.com/protocol/yields/uniswap
https://defillama.com/protocol/yields/curve-finance
https://defillama.com/protocol/treasury/raac
https://www.coingecko.com/en/coins/convex-finance
https://defillama.com/protocol/convex-finance
https://www.cboe.com/us/indices/dashboard/ovx-GVZ/
https://app.koyfin.com/charts/g/fx-faleqt
https://app.koyfin.com/charts/g/fx-32ha89
https://app.koyfin.com/charts/g/ft-gt3aj0
https://www.cboe.com/us/indices/dashboard/ovx/
https://app.rwa.xyz/commodities
https://www.convexfinance.com/
News
https://www.bloomberg.com/news/articles/2026-01-11/asian-stocks-set-to-track-us-gains-oil-in-focus-markets-wrap?srnd=homepage-canada
https://www.bloomberg.com/news/articles/2026-01-12/fed-subpoenas-revive-sell-america-trade-on-autonomy-concerns?srnd=homepage-canada
https://www.bloomberg.com/news/articles/2026-01-07/trump-to-target-institutional-purchases-of-single-family-homes
https://www.bloomberg.com/news/articles/2026-01-08/mortgage-bonds-rally-as-trump-demands-200-billion-of-purchases
https://www.bloomberg.com/news/features/2026-01-11/us-china-capital-flows-reverse-as-global-economic-order-shifts
https://www.bloomberg.com/news/articles/2026-01-12/what-trump-s-credit-card-interest-rate-cap-means-for-consumers
https://www.bloomberg.com/news/articles/2026-01-13/yen-falls-to-weakest-level-since-july-2024-on-political-risks
https://www.bloomberg.com/news/articles/2025-12-29/silver-price-hits-record-high-why-it-has-been-surging-even-more-than-gold
https://www.bloomberg.com/news/articles/2026-01-08/gold-steadies-as-traders-look-to-us-jobs-data-for-rate-cut-clues
https://www.bloomberg.com/news/articles/2026-01-10/more-bonds-are-teetering-on-the-brink-of-junk-credit-weekly
https://www.bloomberg.com/news/articles/2026-01-14/bitcoin-btc-claims-two-month-high-of-over-96-000-on-macro-tailwinds
https://www.bloomberg.com/news/articles/2026-01-08/stablecoin-transactions-rose-to-record-33-trillion-led-by-usdc
https://www.barrons.com/articles/bitcoin-price-xrp-crypto-today-1a94c3f9
https://finance.yahoo.com/news/bitcoin-tops-97000-this-rally-has-further-upside-202458985
https://cryptoslate.com/bitcoin-stumbles-under-eu-us-tariff-stress-while-gold-glitters/
https://www.bloomberg.com/news/articles/2026-01-20/treasuries-join-global-bond-selloff-as-tariff-fears-grip-markets?srnd=homepage-canada
https://www.bloomberg.com/news/articles/2026-01-19/silver-rises-to-record-as-us-eu-tensions-over-greenland-persist
https://www.coindesk.com/markets/2026/01/20/bitcoin-falls-briefly-below-usd90-000-amid-meltdown-markets-liveblog
https://www.bloomberg.com/news/articles/2026-01-22/stock-market-today-dow-s-p-live-updates
https://www.bloomberg.com/news/articles/2026-01-22/gold-climbs-to-record-as-weaker-dollar-extends-scorching-rally
https://www.bloomberg.com/news/articles/2026-01-25/yen-extends-gains-amid-threat-of-intervention-markets-wrap?srnd=homepage-canada
https://www.coindesk.com/markets/2026/01/25/bitcoin-slips-below-usd88-000-ahead-of-fed-week-and-big-tech-earnings
https://www.bloomberg.com/news/articles/2026-01-27/stock-market-today-dow-s-p-live-updates
https://www.bloomberg.com/news/articles/2026-01-27/stock-market-today-dow-s-p-live-updates?srnd=homepage-canada
https://www.bloomberg.com/news/articles/2026-01-29/gold-resumes-rally-after-dropping-on-thursday-in-choppy-session