

Overview
Macroeconomic & Traditional Finance Outlook
The FOMC held interest rates steady, as the economy continues to run hotter than expected, reducing expectations for near-term rate cuts. Equities remained resilient, fueled by AI-driven technology rallies, renewed risk appetite, and strong enthusiasm surrounding the SpaceX IPO. Mortgage rates eased slightly during the month but remained elevated, while the U.S. dollar continued to strengthen alongside high Treasury yields.
Real-World Assets (RWA) Outlook
Housing remained weak as affordability pressures persisted and demand stayed subdued. Oil prices declined following the U.S.-Iran ceasefire and the reopening of the Strait of Hormuz, easing supply concerns and contributing to an oversupplied market. Meanwhile, gold continued to weaken as elevated real yields increased the opportunity cost of holding the non-yield-bearing asset.
Decentralized Finance (DeFi) Outlook
Major cryptocurrencies moved lower this month, with Bitcoin falling below $60K as ETF outflows accelerated and investors questioned whether Strategy Inc. can continue sustaining demand and market confidence. On the regulatory front, the GENIUS Act and Digital Asset Market Clarity Act continued advancing.
RAAC Outlook
As a precautionary measure against potential gold price decline, RAAC burned $6.2M of pmUSD supply to protect its overcollateralization. Further, pmUSD redemptions are on the way, expected to go live the week of July 6th. RAAC's Curve pools maintained a combined TVL of $12 million throughout the month, with iREET having substantial growth. Across all pools, RAAC continues to maintain competitive yields.
Macroeconomic & Traditional Finance Outlook
United States
The Federal Open Market Committee (FOMC) held interest rates steady at 3.50%–3.75% at its June meeting, with the committee remaining largely divided. Newly appointed Governor Kevin Warsh stated that he is willing to keep rates elevated if inflation remains persistent. He also avoided providing forward guidance, instead emphasizing the need for flexibility to respond to incoming economic data as he works to rebuild the Fed's anti-inflation credibility. As a result of Warsh's hawkish stance, markets are now pricing in the possibility of a rate hike as early as September.
CPI rose to 4.2% in May, the highest level in more than three years, as energy prices continued to surge amid the U.S./Israel–Iran conflict and an ongoing AI-driven spending boom. However, core CPI increased only 0.2%, suggesting that the inflationary pressure has not yet fully broadened across the economy. Consumer inflation expectations are also declining, as Americans appear less concerned about sustained price pressures amid stronger spending behavior and easing wage growth.
Table 1: US Indicators
| Indicator | Period | Actual | Previous | Consensus |
|---|---|---|---|---|
| GDP | Q1 | 2.1% | 0.5% | 1.6% |
| Unemployment | May | 4.3% | 4.3% | 4.3% |
| Core CPI (YoY) | May | 2.9% | 2.8% | 2.9% |
| 1YR Inflation Expectations | Jun | 4.6% | 4.8% | 4.6% |
Source: tradingeconomics
On the labor side, job data remained solid, with the unemployment rate falling to 4.296% from 4.337%. U.S. manufacturing also expanded at its fastest pace in four years, with AI emerging as a meaningful economic driver, supporting not only equity valuations such as Nvidia, but also broader demand across the manufacturing sector. Overall, the U.S. economy is running hotter than expected despite elevated interest rates, leaving the Federal Reserve with limited room to ease policy in the near term.
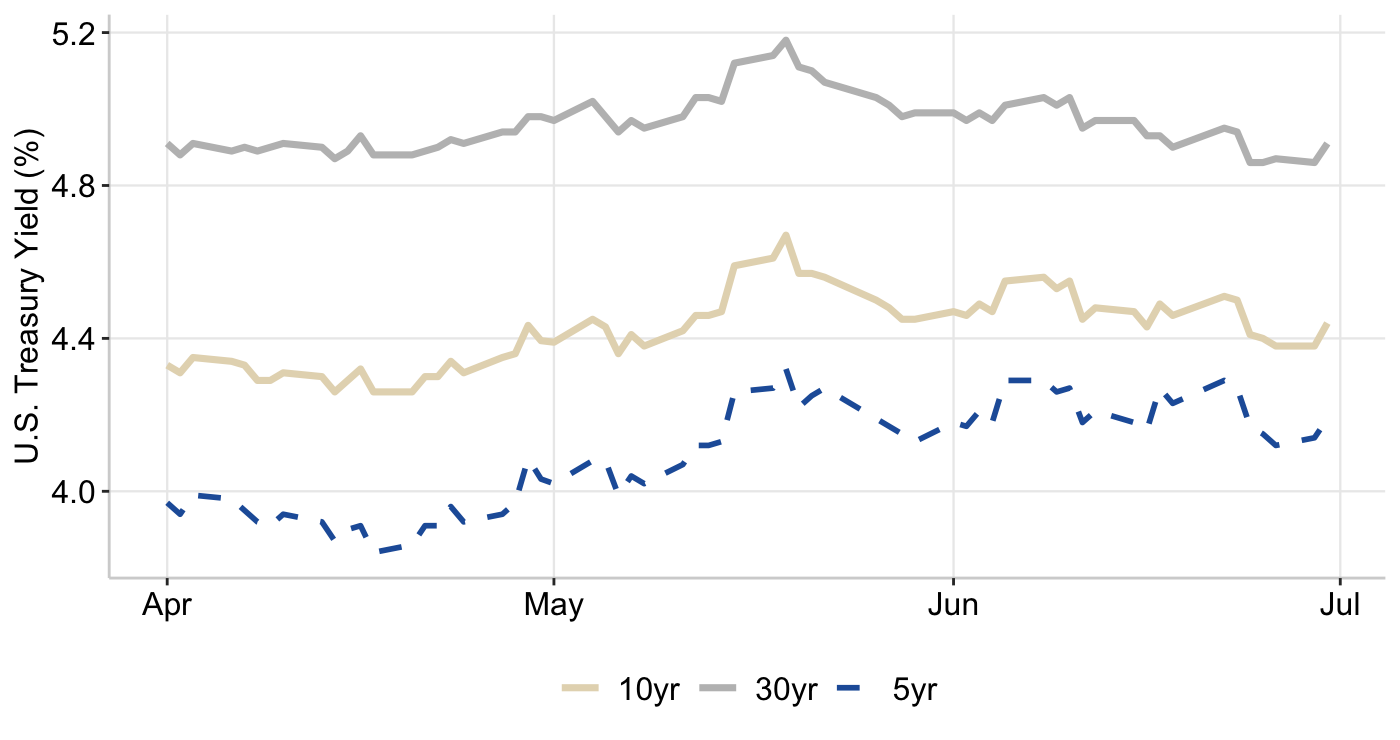
Yields remained elevated, with the 10-year Treasury trading in a range between 4.38% and 4.56%. Early in the month, yields moved higher as risk-on sentiment rotated capital from defensive assets into equities, driven by easing concerns around the Middle East conflict and expectations of moderating inflation. Yields also briefly rose to 4.49% on the day of the FOMC meeting as markets priced in the possibility of additional rate hikes.
Graph 1: U.S. 5-Year, 10-Year, & 30-Year Treasury Yields
Source: FRED
However, toward the end of the month, yields declined as markets scaled back expectations for aggressive Fed tightening. Overall, investors appear confident that inflation risks are easing and that economic conditions are stabilizing. The decline in yields has also provided support for growth-oriented assets, particularly technology stocks and cryptocurrencies.
Governments have issued $504 billion in syndicated sovereign bonds so far in 2026. This reflects a broader shift toward persistently higher public borrowing requirements globally. As fiscal deficits remain elevated, markets may be entering an environment of structurally larger government debt issuance, which could keep bond yields and the cost of capital higher for an extended period.
Credit markets remained resilient this month, with credit spreads holding near historically tight levels at an average of 0.75. U.S. companies also accelerated issuance, raising more than $40 billion in debt as markets rallied on optimism following a tentative U.S/Iran peace agreement. Falling oil prices and reduced expectations for further Fed tightening helped improve conditions across both investment-grade and high-yield markets. This supported strong refinancing activity and enabled corporations to lock in lower borrowing costs while also funding mergers and acquisitions.
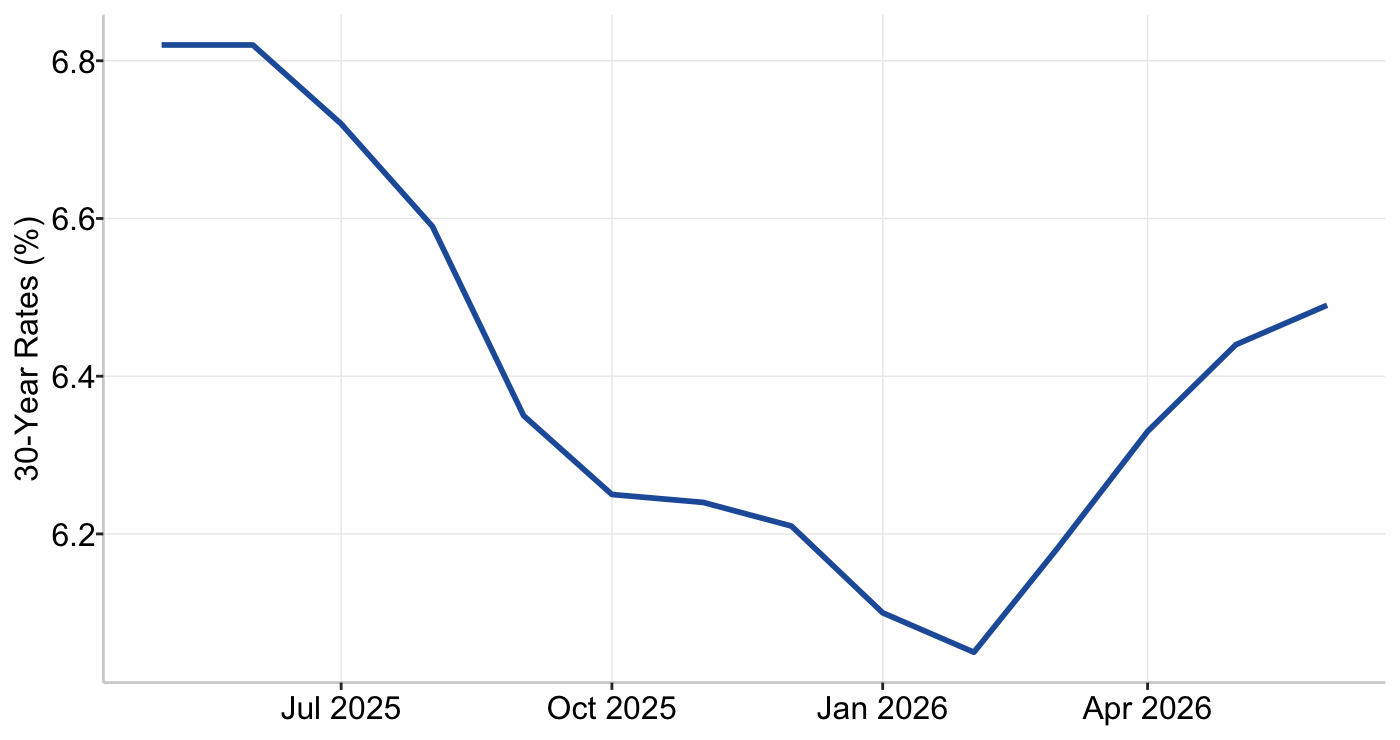
U.S. mortgage rates have edged down to a one-month low of 6.47%, as easing tensions in the Middle East have reduced near-term inflation concerns. However, rates remain elevated overall, offering only limited relief for prospective homebuyers and leaving affordability challenges largely intact across the housing market. Despite this, a growing share of borrowers are managing to secure financing below the 6% level through strategy rather than timing the market. Roughly 16% of borrowers are already obtaining sub-6% mortgage rates by leveraging tools such as lender comparison shopping, new construction incentives, adjustable-rate mortgages, asset-backed lending structures, and rate buydowns.
Graph 2: US 30-Year Mortgage Rates
Source: FRED
Furthermore, the Trump administration is still considering relisting Fannie Mae and Freddie Mac through a public offering, though no final decision has been made. The key concern is that reducing government involvement in the mortgage market could lead to higher mortgage rates, potentially conflicting with broader efforts to improve housing affordability.
Equities
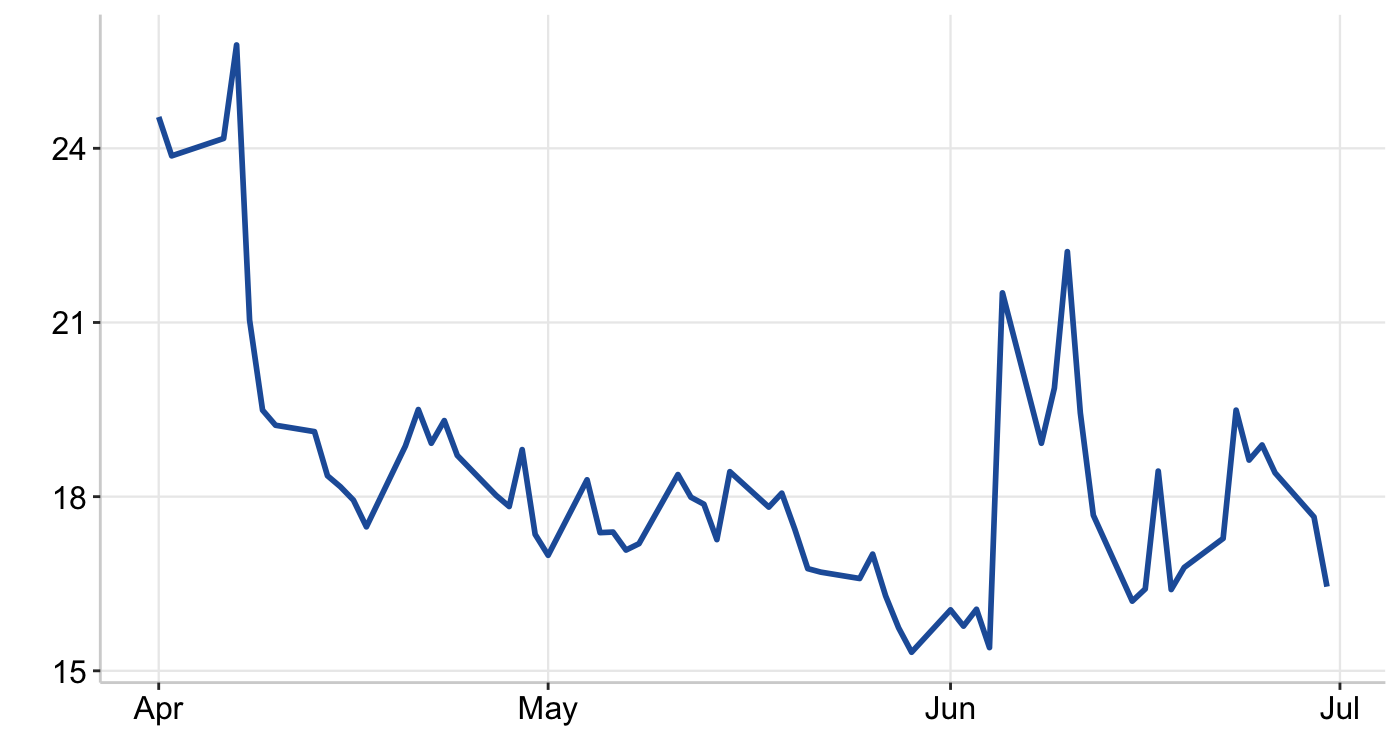
The S&P 500 completed its strongest quarter since 2020, adding more than $8 trillion in market value as strong economic data and sustained optimism around AI continued to fuel a technology-led rally. Investor sentiment remained resilient despite geopolitical tensions, with retail traders consistently “buying the dip” during market pullbacks.
Markets did, however, briefly rotate out of overheated AI and semiconductor names, with the sector losing more than $600 billion in market value as investors reassessed stretched AI-related valuations across technology. During the same period, investors pulled money from U.S. equities for the first time in three months, with equity funds seeing $8.5 billion in outflows in the week through June 24, while fixed income funds absorbed $16.6 billion. Despite this, markets staged a rebound, with the S&P 500 finishing at 7,499.36 and the Nasdaq-100 at 30,276.35, as semiconductor stocks ultimately posted their strongest quarter on record.
Graph 3: CBOE SPX Volatility Index
Source: FRED
SpaceX’s IPO raised $75 billion at a $1.8 trillion valuation, with demand exceeding supply by roughly 4x, making it one of the largest IPOs in history. Following its listing, SpaceX rose for three consecutive trading days and gained as much as 49%, briefly pushing its market capitalization to $2.65 trillion, surpassing Amazon at its peak. Since then, the stock has remained volatile, alongside a $25 billion bond issuance that attracted nearly $90 billion in demand, despite some weakening in secondary market performance.
Overall, AI infrastructure remains the dominant force in markets as capital continues to flow into semiconductors, data centers, cloud infrastructure, and AI software. This reflects a broader multi-year investment cycle, with AI infrastructure positioned as the central theme driving equity markets.
World Currencies
Wall Street has shifted from expecting a weaker dollar to expecting continued strength. The main catalyst is Warsh's hawkish stance on inflation, increasing expectations for higher US interest rates. Strong US economic growth and massive AI investment continue to attract global capital into US markets with higher US interest rates making dollar-denominated assets more attractive than those in Europe and many other regions.
The People’s Bank of China (PBOC) weakened the yuan’s daily fixing for a fourth consecutive session, allowing the currency to soften alongside a strengthening U.S. dollar. With global markets pricing in higher U.S. interest rates, the move appears to be a modest adjustment rather than a shift in broader policy stance from China. Meanwhile, European policymakers continue to push for a stronger yuan in an effort to help address ongoing trade imbalances.
Table 2: World Currencies Performance (Month-to-Date)
| USD | EUR | GBP | JPY | CAD | |
|---|---|---|---|---|---|
| USD | 2.0% | 1.7% | 2.0% | 2.7% | |
| EUR | -2.0% | -0.3% | 0.0% | 0.7% | |
| GBP | -1.6% | 0.3% | 0.3% | 1.0% | |
| JPY | -1.9% | 0.0% | -0.3% | 0.7% | |
| CAD | -2.7% | -0.7% | -1.0% | -0.8% |
Source: Koyfin
The Japanese yen has fallen to its weakest level against the US dollar since 1986, driven by the wide interest-rate gap between Japan and the United States. Although the Bank of Japan has raised interest rates, investors continue to favor higher-yielding US assets, keeping pressure on the yen. Despite that, the yen was the best-performing G-10 currency this past month because every other major currency has weakened even more against the strong US dollar. Moreover, Wall Street banks are abandoning their bullish outlook on the euro and are now forecasting that it will weaken further against the US dollar. Earlier in 2026, many expected the euro to strengthen toward $1.20 now believe the euro could fall to around $1.10 over the next year. The main driver again is the widening interest rate gap between the United States and Europe.
Real-World Assets (RWA) Outlook
RAAC backs its products with real-world assets (RWA), offering greater stability. The following section reviews the current market performance of each underlying asset.
Real Estate Environment
U.S. new-home sales and homebuilder sentiment both declined as high mortgage rates, rising construction costs, and weakening demand continue to pressure the housing sector. While builders have shifted toward constructing smaller homes to improve affordability, the impact remains limited. At the same time, housing inventories have climbed to their highest levels since 2009, signalling slowing demand and an expanding supply of unsold homes.
Commodities overview
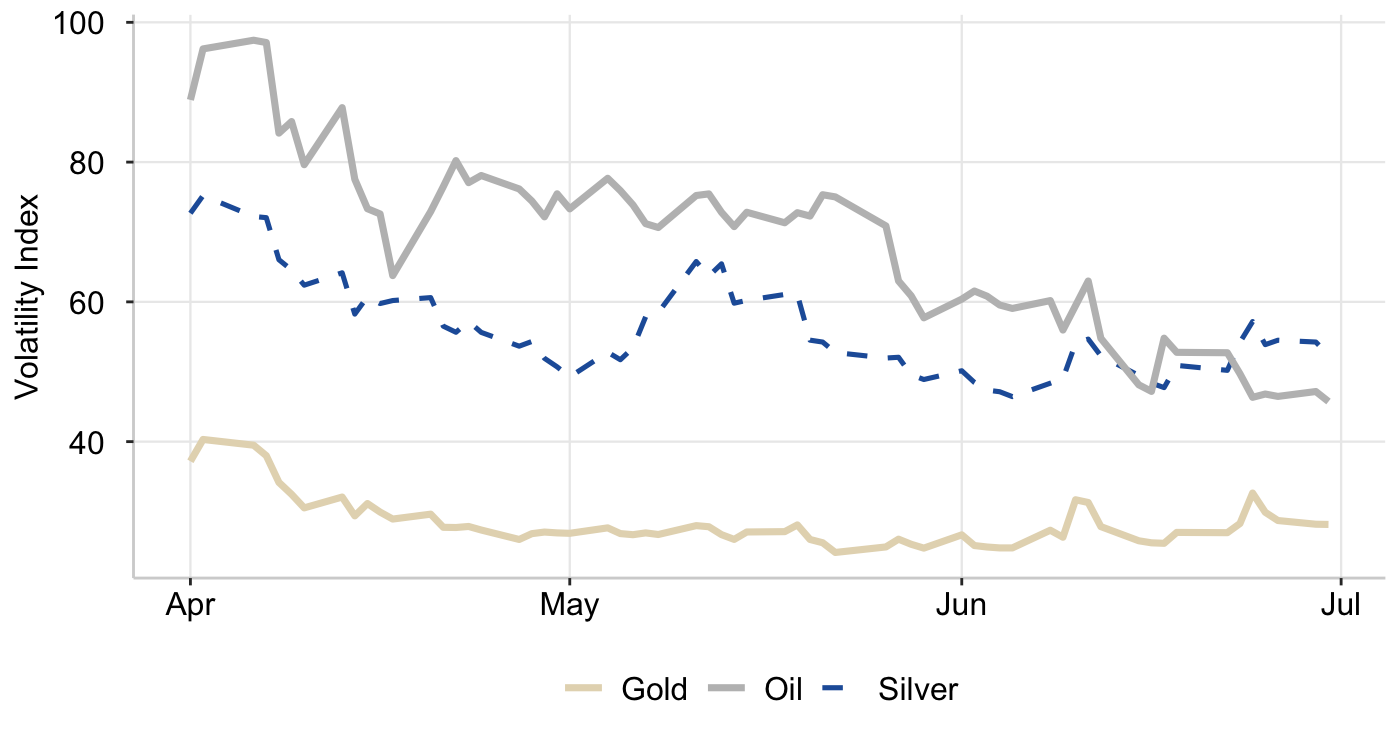
Following the signing of a tentative U.S.–Israel–Iran peace agreement, the Strait of Hormuz reopened, easing supply concerns and triggering a sharp decline in oil prices as inflation pressures began to fade. Brent crude has since fallen below $73 per barrel, with supply normalisation and steady flows through the Strait contributing to softer market conditions. Oil markets have quickly shifted from shortage fears to oversupply dynamics, as the reopening has effectively released a wave of previously constrained crude supply. In addition, futures markets are now in contango, with forward prices trading above spot levels, further signalling expectations of near-term oversupply.
Gold, meanwhile, has been behaving less like a traditional defensive asset and more like a technology-linked macro hedge, as elevated real yields and persistent inflation concerns have outweighed its safe-haven appeal. This has contributed to a 23% decline from war-time highs, with gold briefly touching a low of $3,999/oz earlier in the month.
Graph 4: CBOE Commodities ETF Volatility Index
Source: CBOE
However, as inflation pressures and near-term Fed rate hike expectations eased, alongside momentarily weakening U.S. dollar and softer bond yields, gold saw a rebound driven by unwinding volatility positioning. Prices recovered to approximately $4,487/oz by month-end, with some analysts suggesting gold may be regaining resilience to Middle East-driven risk events going forward.
Decentralized Finance (DeFi) Outlook
Cryptocurrencies
Geopolitical optimism briefly boosted risk appetite, with cryptocurrencies joining the broader rally. However, Bitcoin (BTC) remains more than 50% below its peak, while Ether (ETH) continues to struggle.
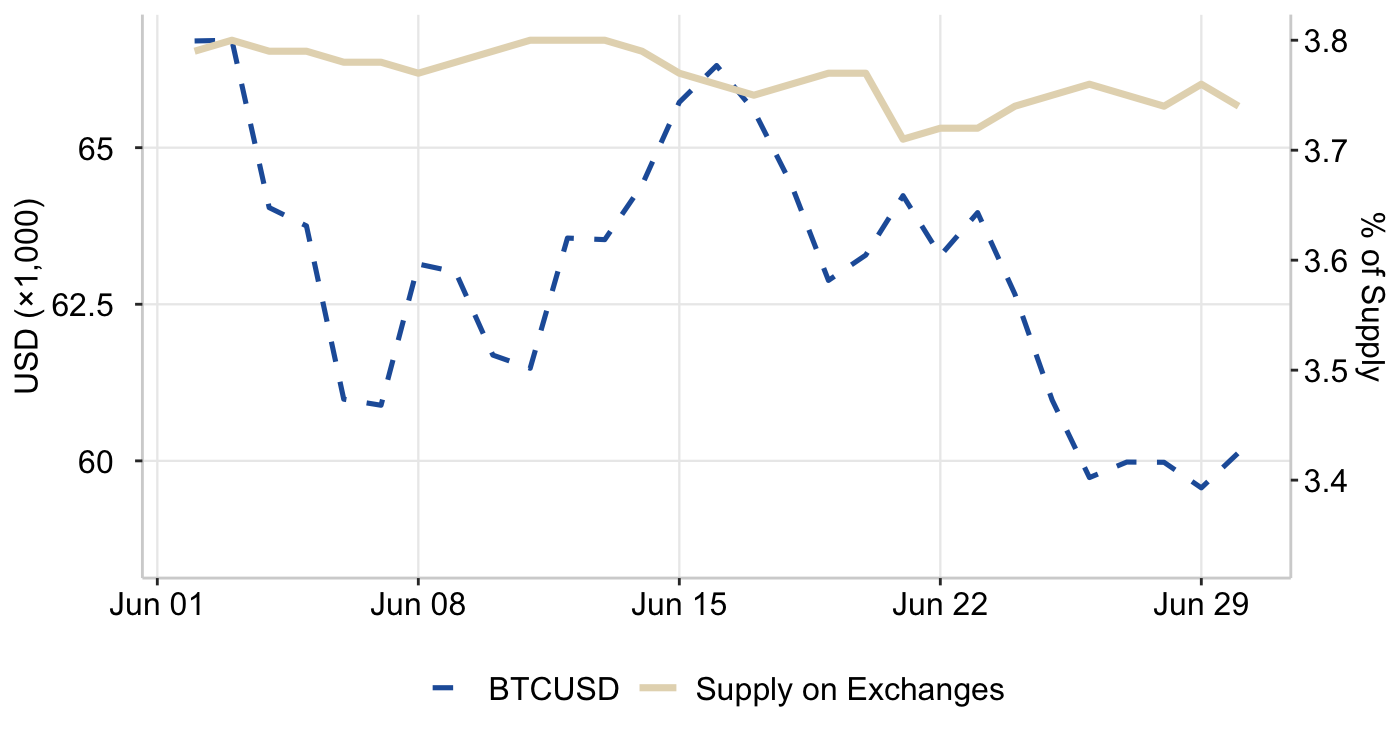
Bitcoin has been under pressure as confidence weakens in Michael Saylor’s Strategy Inc., the largest corporate buyer of Bitcoin. BTC has fallen below $60,000, with the selloff accelerating as retail participation fades and ETF inflows continue to weaken. Bitcoin ETFs remain one of the largest indicators of demand, and since May they have recorded $3.4 billion in outflows, while Ether ETFs have seen around $674 million in outflows, as many ETF investors are now underwater and have reduced incentives to add exposure.
Graph 5: BTCUSD & Percentage of Supply on Exchanges
Source: Thetie
In addition, roughly $800 million in long positions were liquidated within 24 hours, while around $10 billion in Bitcoin options are set to expire soon, adding further pressure to short-term price action. Bitcoin also appears to be struggling in its traditional role as a macro hedge, with limited responsiveness to geopolitical stress or inflation spikes.
Overall, markets are pricing in the possibility that Bitcoin may be losing a key structural demand source. BTC has also closed below its 200-week moving average for the first time in three years, reinforcing concerns that broader momentum and long-term support dynamics are weakening.
Stablecoins
Stablecoins are cryptocurrencies that are commonly held because they offer lower volatility than Bitcoin and Ethereum, allowing users to preserve capital while remaining active on-chain. RAAC issues its own stablecoin, Precious-Metal USD (pmUSD), which operates on the Ethereum blockchain.
Table 3: 1 Month Market Capitalization
| Stablecoin | Position | Market Capitalization |
|---|---|---|
 pmUSD pmUSD |
58 | $66.44M |
 USDT USDT |
1 | $184.685B |
 USDC USDC |
2 | $73.443B |
 PYUSD PYUSD |
10 | $$2.704B |
 crvUSD crvUSD |
34 | $186.2M |
 frxUSD frxUSD |
45 | $112.7M |
 OUSD OUSD |
136 | $7.39M |
Source: DefiLlama
The Ethereum network hosts ~$153.91 billion in stablecoin supply, representing roughly 49.4% of the global market, and continues to serve as the dominant blockchain for stablecoin issuance and activity. U.S. dollar–pegged stablecoins Tether (USDT) and USD Coin (USDC) remain the largest within the ecosystem, accounting for 82.8% of the activity.
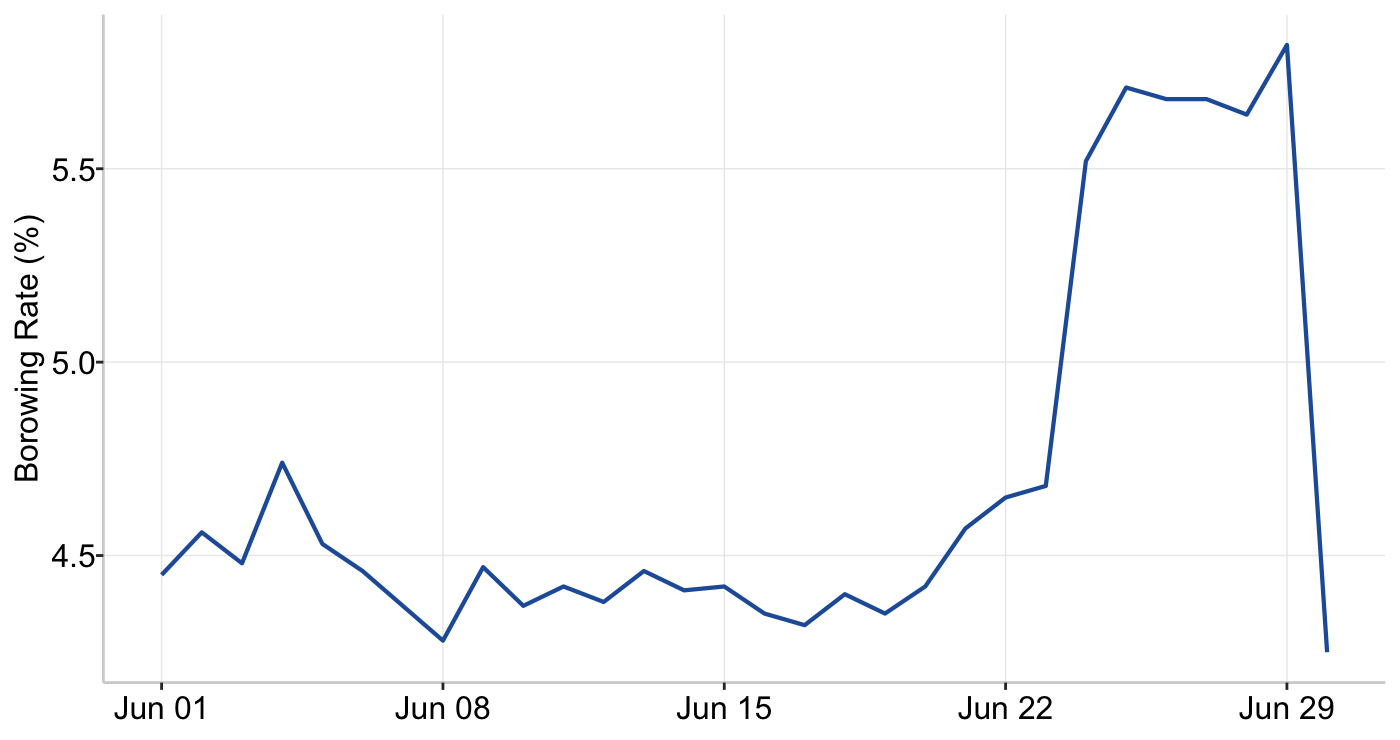
The Ethereum stablecoin borrowing rate represents the average cost of borrowing across lending protocols on the Ethereum network. Over the past month, borrowing rates remained relatively stable, ranging between 4.28% and 4.74%. However, rates briefly spiked to 5.82% as risk sentiment increased before easing back to 4.25%.
Graph 6: Ethereum Stablecoin Borrowing Rate
Source: Blockworks
HYPE reached an all-time high near $77 before pulling back roughly 17%. Despite the decline, user confidence remains strong, with total holders growing 3% in June alone. Meanwhile, protocol revenue has increased for three consecutive months, and the protocol repurchased $135 million worth of HYPE over the past 90 days, significantly exceeding the $64 million in team token unlocks.
The CLARITY Act remains in focus ahead of a July 17 field hearing in New York by the House Subcommittee on Digital Assets. While the House already passed the bill in 2025, the real hurdle is the Senate, where it currently appears to lack sufficient public support. If the bill does not receive a Senate floor vote before the August recess, it risks stalling until 2027. On June 22, U.S. federal agencies jointly proposed a rule requiring permitted payment stablecoin issuers to implement formal Customer Identification Programs (CIP). Under the proposal, issuers must collect and verify Know Your Customer (KYC) information before opening an account. However, the rule applies only to direct relationships with the issuer—holding and transferring stablecoins on the secondary market would not trigger a CIP requirement.
Visa and Mastercard are joining the stablecoin race as they recognize that stablecoins and blockchain networks have the potential to capture a share of their market. Mastercard is already expanding its settlement infrastructure to support regulated on-chain stablecoins, while broader platforms backed by Stripe, Visa, and Mastercard continue to emerge. With their pre-established networks, these firms have an edge moving forward.
RAAC Outlook
Precious-Metal USD (pmUSD)
Precious-Metal USD (pmUSD) is RAAC’s stablecoin, designed to bridge hard-asset collateral with decentralized finance liquidity. pmUSD is backed by gold through tokenized in-situ precious metals reserves. Its issuance is backed by $121.98 million in collateral provided by I-ON Corporation, giving investors exposure to a fully collateralized, gold-backed digital asset on-chain while unlocking secure platforms to earn yield on tokenized gold. With a market capitalization of approximately $66 million, pmUSD currently ranks as the 58th largest stablecoin by market value.
pmUSD remains depegged from its $1.00 USD target, averaging approximately $0.72 throughout the month. RAAC continues to actively monitor the situation and is implementing long-term measures to restore the peg and strengthen overall market liquidity. RAAC's $6-8 million redemption facility is scheduled to go live on the week of July 6, giving holders a clear pathway to redeem pmUSD for physical gold-related value through recognized precious metals dealers, including APMEX and Kitco.
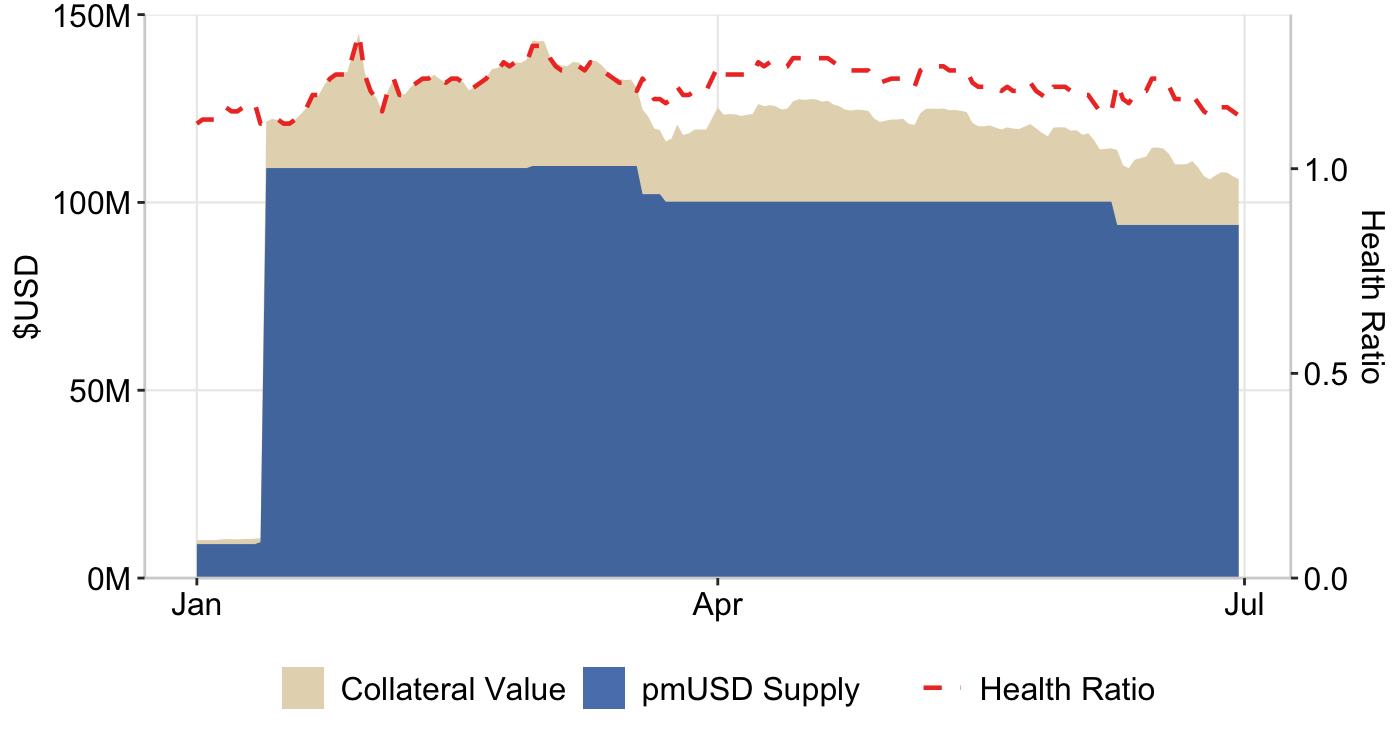
Table 7: Collateral vs pmUSD supply
Source: https://dune.com/4sh4/raac-pmusd
On June 9, RAAC burned an additional 6.2 million pmUSD, reducing the total supply to ~$94 million. Similar to the burn in March 2026, this was a proactive measure taken in response to declining gold prices, which serve as the collateral backing pmUSD. Gold has been in a four-month downturn and has now entered bear market territory. Prices fell to approximately $4,250/oz, the same level that triggered the March 2026 supply burn. In response to the decline in gold prices, RAAC reduced the pmUSD supply to maintain strong collateral coverage and protect the stability of the system. Following this adjustment, gold prices could decline to ~$3,900/oz before any further action would be required from RAAC. As a result, pmUSD's health ratio improved from 1.14 to 1.21, strengthening the protocol's overcollateralization.
$iREET
The Index Real Estate Token ($iREET) is RAAC’s tokenized real estate index, establishing RAAC among the best DeFi products backed by real estate in 2026. Designed to give users liquid, diversified exposure to real-world real estate on-chain, it positions RAAC as one of the most transparent real asset lending platforms on-chain.
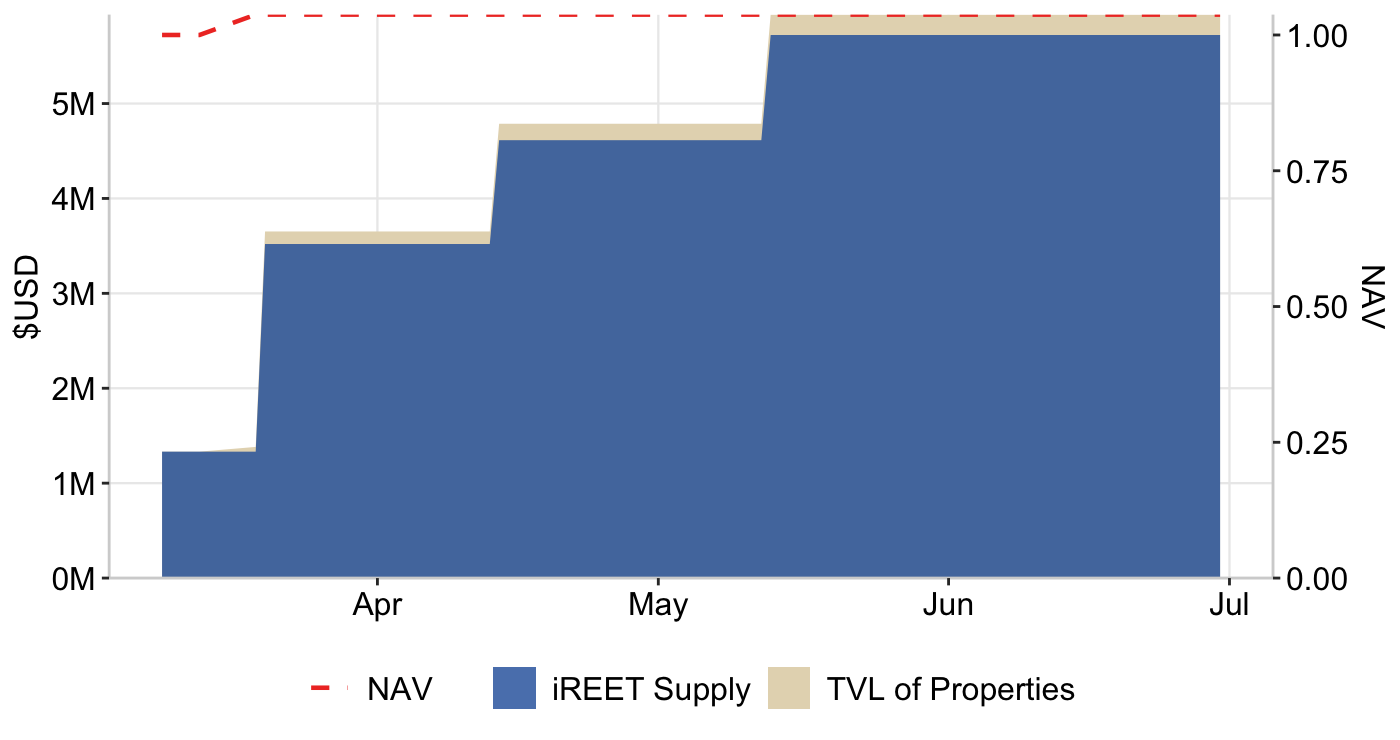
Graph 8: NAV per $iREET
Source: Dune
Notes: NAV per $iREET = TVL / Circulating Supply
RAAC has continued acquiring properties to increase the value of the index and plans to expand the portfolio further. The iREET vault now holds 17 properties with a combined value of $5.94 million, supporting a circulating supply of 5.72 million iREET tokens. The net asset value (NAV) per iREET is $1.0375, above the current market price of $1.0154.
The Properties generate approximately $42.7K in monthly rental income, which flows back into and further strengthens RAAC's lending ecosystem. Additionally, RAAC also earns fees from Curve. Over the past month, RAAC has added ~$483 USD worth of iREET fees back into its liquidity pools, further supporting liquidity depth and yield generation.
Glimpse into the Curve Wars
RAAC is built directly within Curve Finance and actively participates in the Curve Wars, the ongoing competition to control governance power within the protocol. By locking CRV tokens, participants receive vote-escrowed CRV (veCRV), which grants voting rights to determine which liquidity pools receive reward emissions, ultimately shaping yield levels and liquidity depth. Protocols such as Convex Finance and Stake DAO have accumulated significant veCRV positions and, through their own tokens, offer alternative pathways to access Curve governance power.
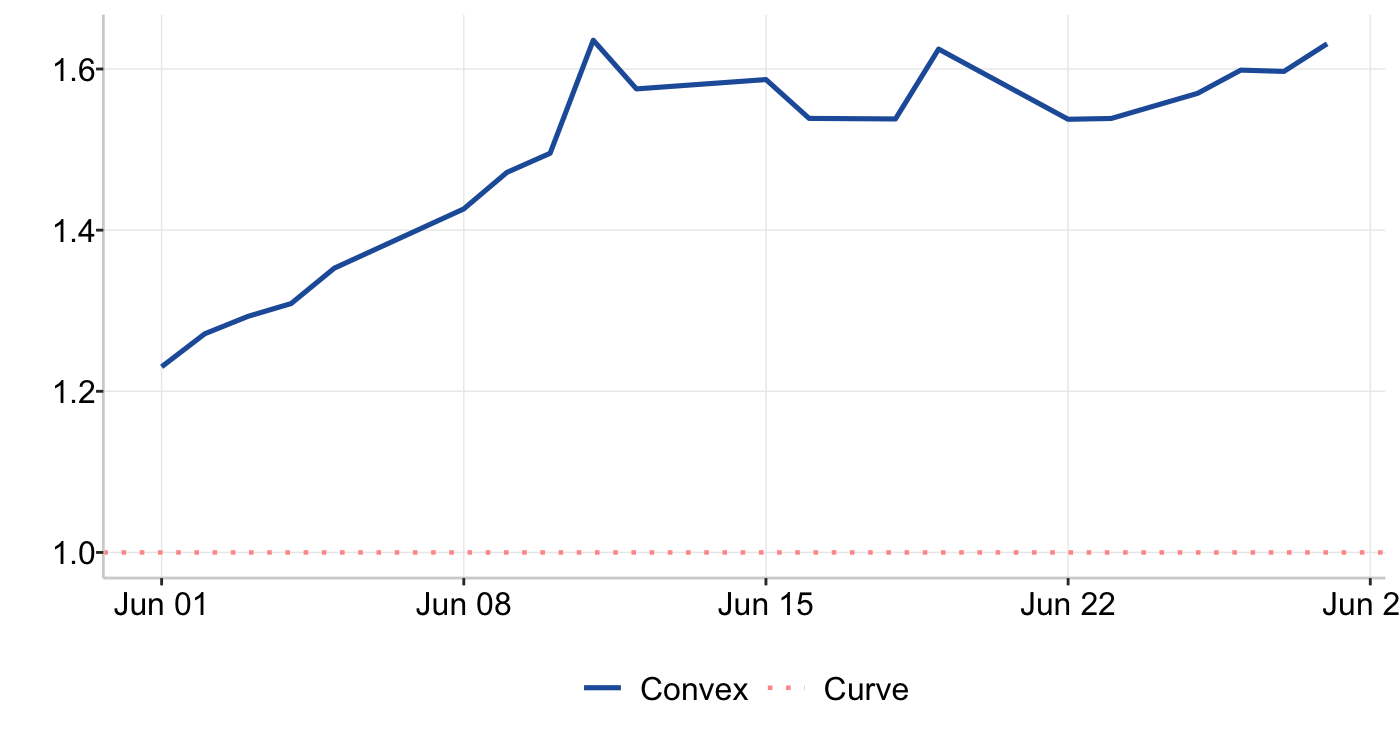
The Kingmaker Ratio is a RAAC-specific metric used to evaluate whether acquiring veCRV directly or accumulating voting power through another protocol is the most efficient strategy per dollar. The metric is defined as:
Kingmaker Ratio = veCRV/$ via protocol iveCRV/$ via CRV
Using the above equation, the ratio is calculated for Convex (vlCVX). While StakeDAO is another viable route, it is better suited for individual users rather than the protocol itself. Graph 8 tracks the evolution of this ratio over the month of June, highlighting changes in relative efficiency across each strategy.
Graph 9: Kingmaker Ratio
Source: buycvxcorrect.netlify.app
The ratio remains above 1.00, indicating that acquiring voting power through Convex (vlCVX) is more efficient than purchasing veCRV directly. Moreover, the ratio has trended higher over the past month, reaching 1.6, reinforcing Convex as the most capital-efficient route, with higher voting power per $1 spent compared to direct veCRV acquisition. This strategy has enabled RAAC to build significant governance influence, positioning it as the fourth-largest governance participant on Curve. As a result, RAAC is consistently able to direct emissions toward its own liquidity pools, creating a structural advantage that supports more sustainable and predictable yield generation.
Liquidity pools
RAAC has 4 liquidity pools active on Curve Finance:
- pmUSD/crvUSD - Launched Dec 25, 2025
- pmUSD/frxUSD - Launched Dec 25, 2025
- pmUSD/OUSD - Launched Feb 28, 2026
- iREET/pmUSD - Launched Mar 12, 2026
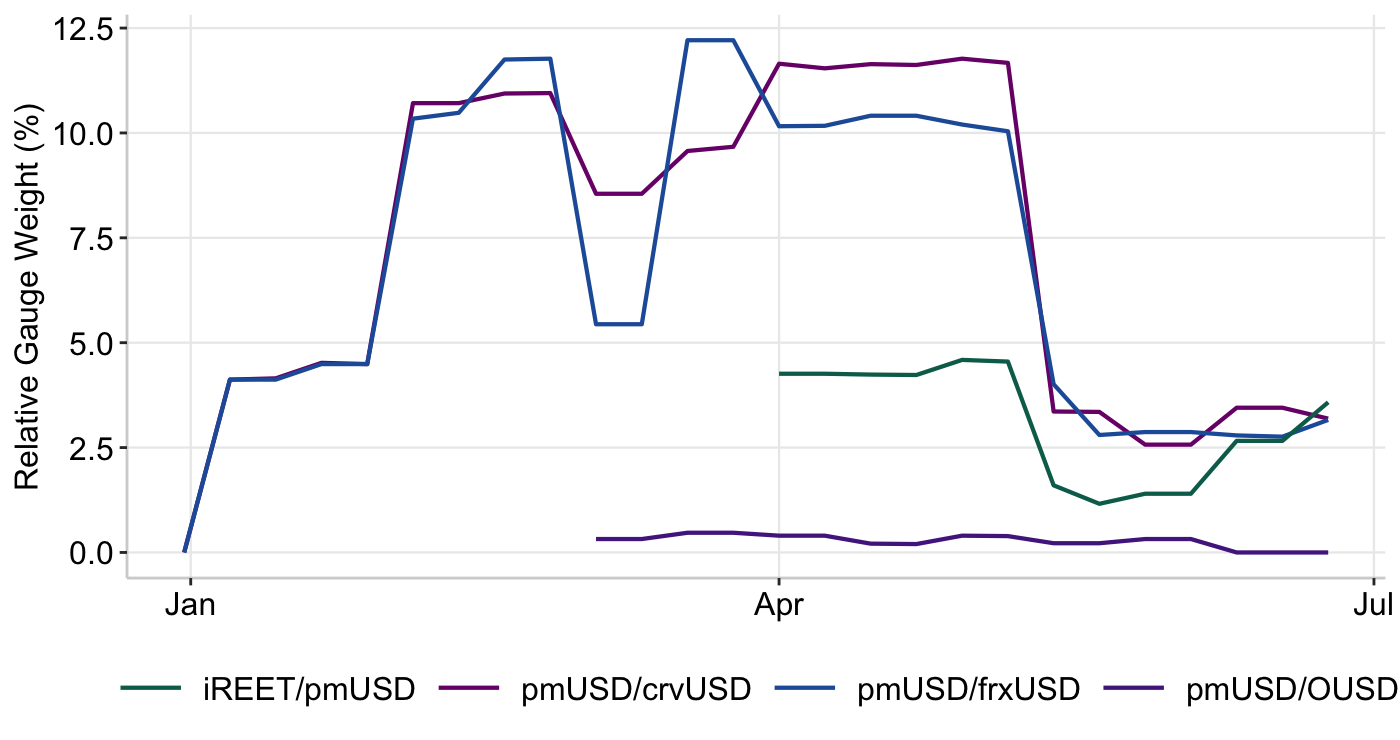
RAAC is built on the existing Curve Finance infrastructure and ecosystem, including active participation in the Curve Wars. Through this participation, RAAC has directed liquidity to its Curve pools. Graph 10 illustrates the relative gauge weight of RAAC’s liquidity pools within the Curve Finance ecosystem.
Graph 10: RAAC Curve Pools - Gauges
Source: curve.finance
RAAC’s Curve gauges have recovered these past epoch as the protocol has been directing additional incentives. While RAAC's own voting power provides a base gauge weight of 4.49%, the protocol achieved 9.92% total veCRV gauge weighting. Based on a CRV price of $0.194, this equates to approximately $84,800 in CRV emissions directed toward RAAC's Curve pools, allowing for competitive yields.
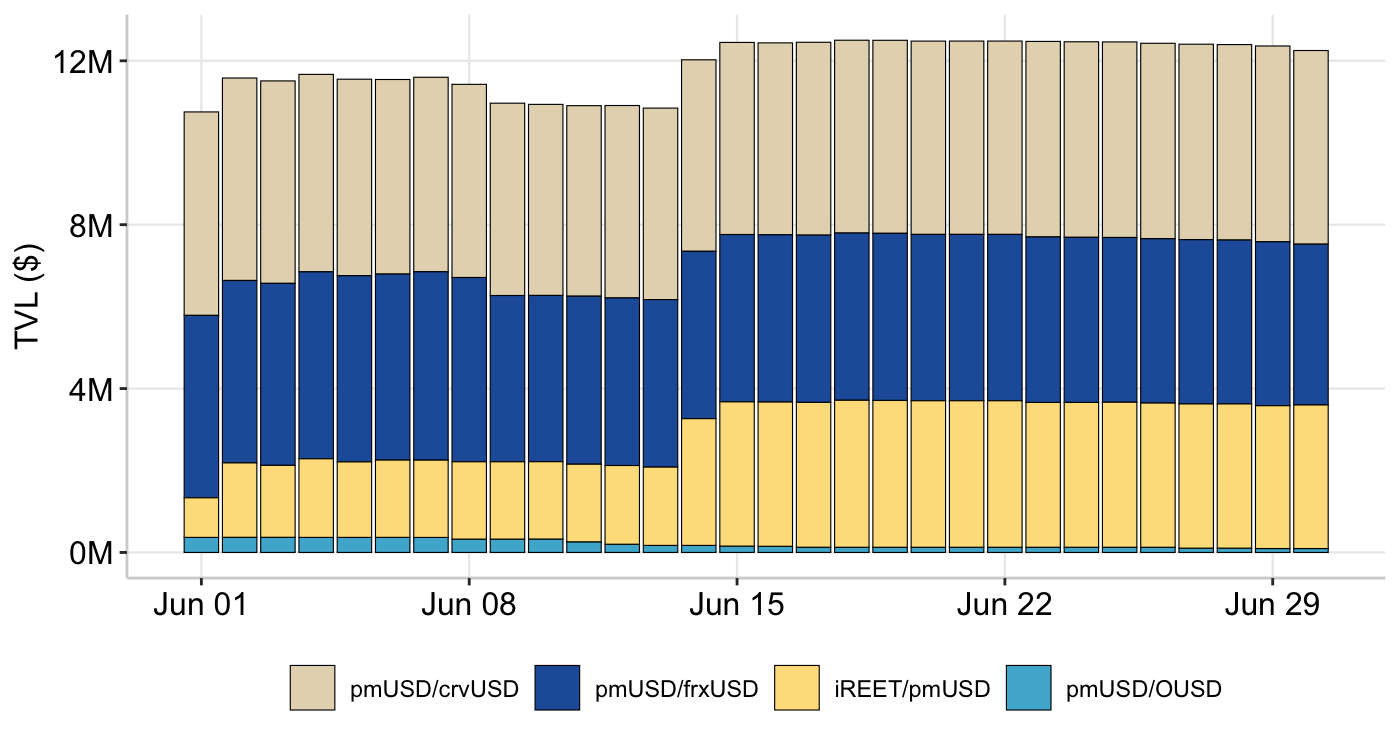
RAAC’s Curve pools maintained a combined TVL of ~$12 million throughout the month. Following the maturity of the iREET bonds, the iREET/pmUSD pool experienced strong growth, with its TVL increasing from $0.90 million to $1.80 million. RAAC also managed liquidity by taking advantage of a short-term price increase, selling ~$32K of iREET around the $1.06 level to rebalance the iREET/pmUSD pool.
The more established pmUSD/crvUSD and pmUSD/frxUSD pools continued to provide the majority of liquidity, each maintaining roughly $4 million in TVL. Meanwhile, the iREET/pmUSD pool has continued to expand, growing from $0.90 million at the beginning of the month to ~$3.5 million in TVL by the end.
Graph 11: RAAC Curve Pools - Total Volume Locked (TVL)
Source: https://dune.com/4sh4/raac-pmusd
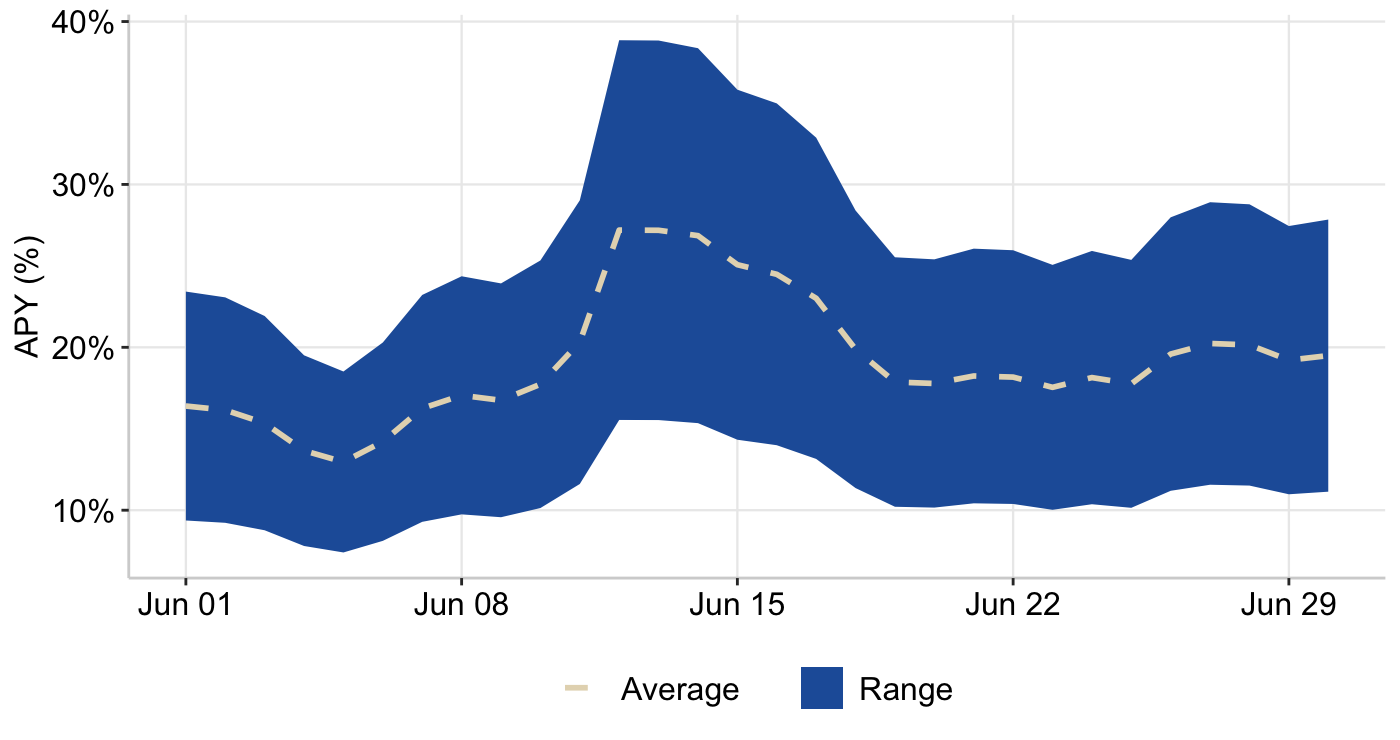
The weighted reward APY across RAAC’s Curve liquidity pools ranged from 7.4% to 38% over the past month, with average yields increasing compared to the previous month. The iREET/pmUSD pool currently offers the highest returns after receiving 80% of RAAC’s voting incentives, resulting in APYs ranging from 9.1% to 67%, with an average of ~26%. The remaining Curve pools also continue to offer competitive yields, with both pmUSD/crvUSD and pmUSD/frxUSD reaching maximum APYs of ~30–35%
Nonetheless, the yields offered across RAAC’s Curve pools continue to be highly competitive, with the iREET/pmUSD pool remaining the primary driver of active yield opportunities. This demonstrates that the protocol’s voting and incentive strategy is functioning as intended even under stressed market conditions.
Figure 12: RAAC Curve Pools - Weighted Reward APY
Source: curve.finance
Participants can further enhance their yields by depositing LP tokens into protocols such as Stake DAO, Convex Finance, Beefy Finance, and Yearn Finance to access boosted rewards. Lastly, $iREET can now be transacted on agra, allowing users to buy or sell $iREET in size with no slippage on large trades and settlement directly on-chain.
Resources
Data
https://tradingeconomics.com/indicators
https://fred.stlouisfed.org/series/DGS10
https://fred.stlouisfed.org/series/DGS5#
https://fred.stlouisfed.org/series/DGS30)
https://fred.stlouisfed.org/series/BAMLC0A0CM#
https://fred.stlouisfed.org/series/PRIME
https://fred.stlouisfed.org/series/MORTGAGE30US
https://app.koyfin.com/gyld
https://fred.stlouisfed.org/series/VIXCLS
https://defillama.com/stablecoins
https://www.coingecko.com
https://www.cboe.com/us/indices/dashboard/ovx-GVZ/
https://www.cboe.com/us/indices/dashboard/ovx/
https://www.convexfinance.com/
https://dune.com/4sh4/raac-pmusd
https://www.curve.finance/dao/ethereum/gauges
https://www.curve.finance/dex/ethereum/pools?search=pmusd
https://www.stakedao.org/yield?search=pmusd
https://curve.convexfinance.com/stake
https://app.beefy.com/
https://yearn.fi/vaults?type=lp&search=pmusd
https://app.morpho.org/ethereum/market/0x72cc79433e9f91c2a185422725510f4bdd19c9006010f464f851468b2371b756/srroyusdc-pmusd?tab=market#advanced
News
https://www.federalregister.gov/documents/2026/06/22/2026-12460/permitted-payment-stablecoin-issuer-customer-identification-program
https://finance.yahoo.com/markets/crypto/articles/hype-drops-17-record-high-125437820.html
https://www.forbes.com/sites/digital-assets/2026/06/11/why-visa-and-mastercard-are-building-the-stablecoin-that-could-sink-circle/
https://www.mastercard.com/global/en/news-and-trends/press/2026/june/mastercard-expands-settlement-capabilities-to-include-stablecoin.html
https://www.theblock.co/post/405247/federal-reserve-rolls-out-proposing-rulemaking-requiring-stablecoin-issuers-to-maintain-customer-identification-program
https://www.bloomberg.com/news/articles/2026-05-31/oil-climbs-as-us-iran-ceasefire-remains-elusive-markets-wrap
https://www.bloomberg.com/news/articles/2026-06-01/us-manufacturing-activity-expands-by-most-in-four-years
https://www.bloomberg.com/news/articles/2026-06-02/us-job-openings-jump-to-nearly-two-year-high-as-layoffs-fall
https://www.bloomberg.com/news/articles/2026-06-01/oil-holds-gains-us-futures-slip-on-war-confusion-markets-wrap
https://www.bloomberg.com/news/articles/2026-06-02/asian-stocks-poised-to-gain-as-ai-rally-extends-markets-wrap
https://www.bloomberg.com/news/articles/2026-06-03/a-180-crypto-rally-shows-new-investing-era-as-bitcoin-stumbles
https://www.bloomberg.com/news/articles/2026-06-03/asian-stocks-set-to-fall-on-fresh-us-iran-clashes-markets-wrap
https://www.bloomberg.com/news/articles/2026-06-07/us-stock-futures-drop-after-tech-selloff-oil-up-markets-wrap
https://www.bloomberg.com/news/articles/2026-06-08/bitcoin-steadies-after-60-000-breach-as-saylor-hints-at-buying
https://www.bloomberg.com/news/articles/2026-06-05/trump-says-us-still-weighing-share-sale-for-fannie-freddie
https://www.bloomberg.com/news/articles/2026-06-07/gold-holds-decline-as-iran-attacks-threatens-mideast-ceasefire
https://www.bloomberg.com/news/articles/2026-06-09/treasury-market-is-telling-kevin-warsh-rates-need-to-be-higher
https://www.bloomberg.com/news/articles/2026-06-08/stock-market-today-dow-s-p-live-updates
https://www.bloomberg.com/news/articles/2026-06-09/treasuries-advance-before-auction-as-oil-prices-retreat-further
https://www.bloomberg.com/news/articles/2026-06-09/stock-market-today-dow-s-p-live-updates
https://www.bloomberg.com/news/articles/2026-06-10/governments-are-selling-bonds-at-record-pace-as-spending-soars
https://www.bloomberg.com/news/articles/2026-06-10/us-inflation-accelerates-though-core-gauge-comes-in-softer
https://www.bloomberg.com/news/articles/2026-06-10/stock-market-today-dow-s-p-live-updates
https://www.bloomberg.com/news/articles/2026-06-11/asian-stocks-to-gain-as-trump-signals-us-iran-deal-markets-wrap
https://www.bloomberg.com/news/articles/2026-06-13/there-s-a-bug-in-the-gold-trade-as-miners-move-like-meme-stocks
https://www.bloomberg.com/news/articles/2026-06-14/us-futures-climb-oil-falls-on-iran-peace-deal-markets-wrap
https://www.bloomberg.com/news/articles/2026-06-12/what-to-know-about-spacex-s-record-breaking-ipo
https://www.bloomberg.com/news/articles/2026-06-15/spacex-shares-rise-set-to-extend-gains-after-record-ipo-mqexlibz
https://www.bloomberg.com/news/live-blog/2026-06-16/bank-of-japan-monetary-policy-decision
https://www.bloomberg.com/news/articles/2026-06-16/brent-oil-falls-below-80-with-us-iran-deal-set-to-add-supply
https://www.bloomberg.com/news/articles/2026-06-16/spacex-spcx-stock-set-for-more-than-50-jump-in-just-three-sessions
https://www.bloomberg.com/news/articles/2026-06-16/bond-options-traders-split-on-fed-rate-path-as-warsh-era-begins
https://www.bloomberg.com/news/articles/2026-06-17/fed-holds-rates-steady-officials-split-over-hikes-this-year
https://www.bloomberg.com/news/articles/2026-06-17/asian-stocks-bonds-to-fall-on-hawkish-fed-signals-markets-wrap
https://www.bloomberg.com/news/articles/2026-06-18/asian-stocks-to-rise-as-us-iran-deal-lifts-mood-markets-wrap
https://www.bloomberg.com/news/articles/2026-06-22/treasuries-decline-as-trump-s-iran-threats-stoke-inflation-fears
https://www.bloomberg.com/news/articles/2026-06-22/asian-stocks-set-for-gains-as-oil-holds-losses-markets-wrap
https://www.bloomberg.com/news/articles/2026-06-23/spacex-rout-set-to-push-market-value-below-2-trillion
https://www.bloomberg.com/news/articles/2026-06-18/us-mortgage-rates-fall-to-lowest-in-month-as-mideast-tensions-ease
https://www.bloomberg.com/news/articles/2026-06-15/us-homebuilder-sentiment-falls-driven-by-large-drop-in-south
https://www.bloomberg.com/news/articles/2026-06-22/how-to-get-a-mortgage-rate-under-6-in-2026
https://www.bloomberg.com/news/articles/2026-06-15/companies-rush-to-borrow-cash-as-us-iran-deal-spurs-bullish-mood
https://www.bloomberg.com/news/articles/2026-06-24/us-new-home-sales-unexpectedly-fall-as-mortgage-rates-stay-high
https://www.bloomberg.com/news/articles/2026-06-24/us-stock-futures-surge-on-micron-s-strong-forecast-markets-wrap
https://www.bloomberg.com/news/articles/2026-06-24/bitcoin-breaks-60-000-again-as-crypto-s-biggest-buyers-wobble
https://www.bloomberg.com/news/articles/2026-06-24/hormuz-reopening-is-quickly-flooding-oil-markets-with-supply
https://www.bloomberg.com/news/articles/2026-06-25/us-inflation-climbs-to-three-year-high-spending-picks-up
https://www.bloomberg.com/news/articles/2026-06-25/michael-saylor-s-misfiring-funding-model-jolts-bitcoin-traders
https://www.bloomberg.com/news/articles/2026-06-25/asia-stocks-set-for-choppy-open-on-tech-volatility-markets-wrap
https://www.bloomberg.com/news/articles/2026-06-24/china-weakens-yuan-fixing-for-fourth-session-as-dollar-advances
https://www.bloomberg.com/news/articles/2026-06-29/yen-jpy-usd-hits-four-decade-low-in-historic-slide-that-s-rattled-japan
https://www.bloomberg.com/news/articles/2026-06-28/euro-s-run-looks-over-as-wall-street-targets-slide-toward-1-10
https://www.bloomberg.com/news/articles/2026-06-25/yen-outperforms-g-10-peers-despite-hovering-near-1986-low
https://www.bloomberg.com/news/articles/2026-06-29/gold-declines-as-fresh-us-iran-tension-fans-inflation-concerns
https://www.bloomberg.com/news/articles/2026-06-26/bond-traders-stunned-as-losses-on-spacex-s-new-debt-keep-growing
https://www.bloomberg.com/news/articles/2026-06-29/japan-stocks-set-to-climb-as-yen-hits-40-year-low-markets-wrap
https://www.bloomberg.com/news/articles/2026-06-28/us-futures-climb-on-reports-peace-talks-to-resume-markets-wrap