
Overview
The FOMC kept interest rates unchanged for a second consecutive meeting at 3.6%, as the likelihood of near-term rate cuts declined amid the escalating U.S./Israel–Iran conflict. Markets reacted on a headline-by-headline basis, with inflationary pressures from rising oil prices remaining the dominant driver of risk-off sentiment.
As a result, global bond yields, the U.S. dollar, and mortgage rates moved higher, while equity markets declined. Gold fluctuated throughout the month, at times behaving like a pro-cyclical risk asset. Bitcoin continued to trade as a risk asset, closely tracking equity market movements.
Meanwhile, Curve Finance allocations remained concentrated, with RAAC receiving the highest share of voting allocations and controlling approximately 4.1% of total voting power. pmUSD continued to function as a reliable stablecoin; its supply was reduced to maintain the health ratio, with capital reallocated toward RAAC’s new product, iREET.
Macroeconomic & Traditional Finance Outlook
United States
The Federal Open Market Committee left interest rates unchanged for a second consecutive meeting at 3.6%. The central bank has forecast one rate cut in 2026, while traders have pushed back expectations to zero cuts this year following a surge in oil prices that could generate inflationary pressures. Markets are now pricing in a higher-for-longer rate environment, with cuts delayed until mid-2027.
Core CPI slowed to 2.5% year-over-year, the lowest level in nearly five years. However, economic shocks stemming from the U.S./Israel–Iran conflict could reverse this progress. Moreover, U.S. growth came in weaker than expected, with the unemployment rate elevated in February. Investors are concerned about a potential return to stagflation, similar to the 2021–2023 period, leaving the Fed in a difficult position, whether to cut rates to support growth or maintain higher rates to control inflation.
Table 1: US Indicators
| Indicator | Period | Actual | Previous | Consensus |
|---|---|---|---|---|
| GDP | Q4 | 0.7% | 4.4% | 1.4% |
| Unemployment | Feb | 4.4% | 4.3% | 4.3% |
| Core CPI (YoY) | Feb | 2.5% | 2.5% | 2.5% |
| 1YR Inflation Expectations | Mar | 3.8% | 3.4% | 3.4% |
Source: tradingeconomics
Table 2: Alternative Inflation Metric: Truflation US CPI Inflation Index (YoY)
| Period | Highest | Lowest | Average |
|---|---|---|---|
| March | 1.78% | 0.78% | 1.33% |
| February | 1.49% | 0.68% | 0.94% |
Source: truflation
Notes: The Truflation CPI Index relies on current consumer and spending data to deliver daily inflation readings that better capture rapid economic changes overlooked by traditional inflation measures.
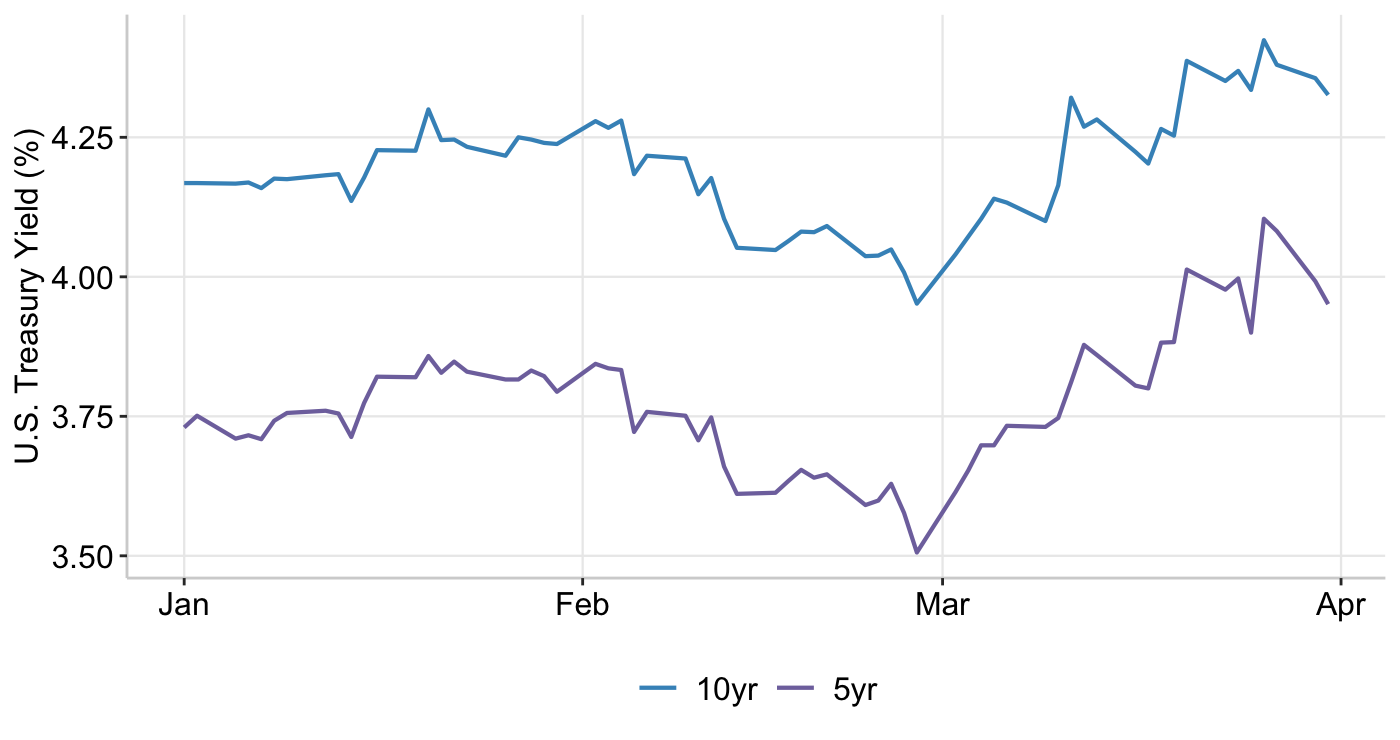
For most of the month, expectations of higher interest rates for longer, driven by inflationary pressures from oil supply constraints, pushed yields to their highest levels in several weeks. Early in the month, the 10-year Treasury yield rose 10 basis points to 4.03%, marking its largest increase since October, as traders scaled back expectations for Fed rate cuts.
Typically, during geopolitical crises, investors turn to U.S. Treasuries as safe-haven assets, which drives yields lower. However, in this instance, inflationary risks outweighed the safe-haven effect, as investors grew concerned that government borrowing would increase. By the end of the month, the 10-year yield reached 4.43%, its highest level in over six months. U.S. global bonds have already erased their gains for 2026, while European bonds have declined further, reflecting Europe’s heavy reliance on imported oil.
Graph 1: U.S. 5-Year & 10-Year Treasury Yields
Source: Koyfin
Yields fluctuated throughout the month in response to evolving headlines. Toward the end of the period, markets began to favor safe-haven assets, leading yields to ease as investor sentiment shifted from an inflation-driven narrative to one centered on potential economic slowdown.
Credit spreads remain relatively tight by historical standards, fluctuating between 0.82 and 0.94. However, the sector is facing a liquidity squeeze, as private credit funds have capped withdrawals at approximately 5% per quarter, resulting in investors receiving only partial payouts. Of the $13 billion in requested withdrawals, $4.6 billion remains locked. Private capital expanded significantly by attracting retail investors with high yields, but the liquidity offered has proven unrealistic under stress conditions. This has prompted firms such as JPMorgan Chase & Co. to launch new private credit funds with improved liquidity features.
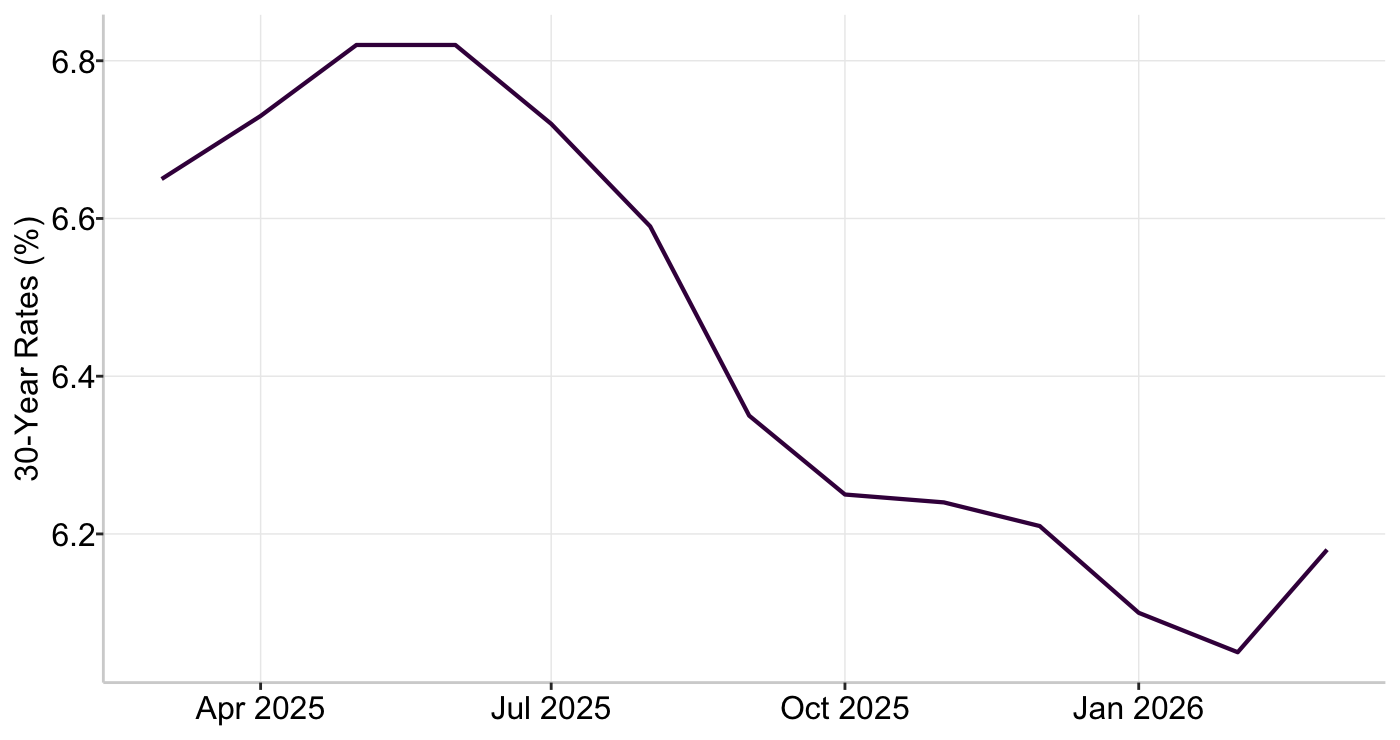
The average 30-year mortgage rate rose to 6.38%, the highest level in six months, up from prior lows near 6%. Mortgage rates tend to track long-term bond yields rather than solely central bank policy, and ongoing tensions in the Middle East are reinforcing expectations of higher rates for longer. This is weighing on housing demand ahead of the peak spring season, as borrowing costs rise.
Graph 2: US 30-Year Mortgage Rates
Source: FRED
Equities
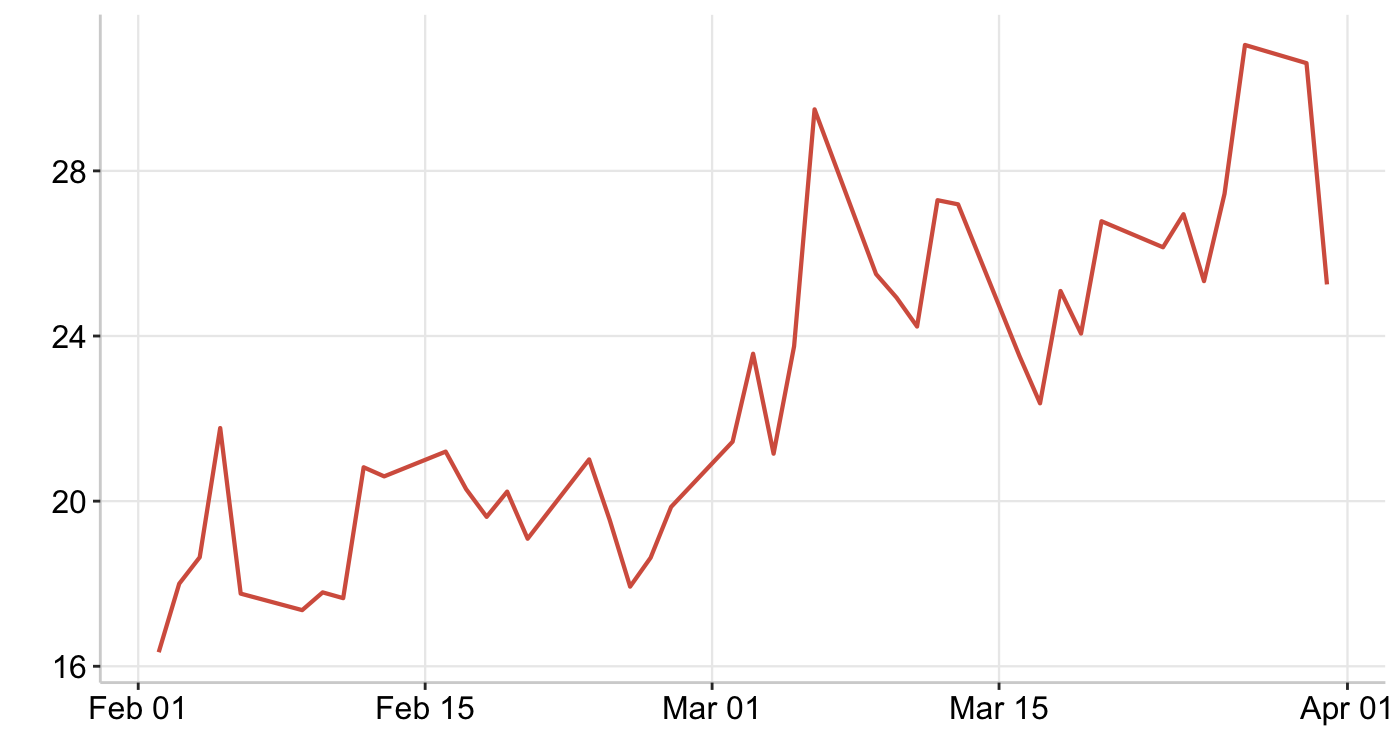
Markets reacted on a headline-by-headline basis, as developments in the U.S./Israel–Iran conflict drove overall sentiment. Throughout the month, volatility remained elevated, with global equities trending lower and the S&P 500 falling to its lowest level since September. Higher oil prices, declining profit expectations, and tighter financial conditions prompted investors to pull back from risk assets. The volatility index rose to 31.61, reflecting heightened uncertainty.
At the same time, solid economic data provided some offset to geopolitical concerns. The S&P 500 rose following data showing that the U.S. services sector expanded at its fastest pace since mid-2022, supported by strong new orders and business activity. However, gains were short-lived, as weaker U.S. labour market data reinforced concerns that the economy may be slowing.
Technology stocks experienced a selloff after the U.S. government considered requiring permits for global sales of AI semiconductors. Later in the month, the sector led gains, supported by expectations of $1 trillion in AI chip revenue by 2027 and strong anticipated earnings growth, which provided a fundamental cushion despite geopolitical risks.
Graph 3: CBOE SPX Volatility Index
Source: FRED
Overall, investors struggled to interpret conflicting signals related to energy supply, macroeconomic conditions, and the trajectory of the conflict, resulting in sharp market swings. Toward the end of the month, optimism surrounding a potential de-escalation in the Middle East improved sentiment, with the S&P 500 rising 2.9%, its largest gain since May 2025, and the Nasdaq advancing 3.8%.
Markets have been particularly reactive, as oversold conditions amplified price movements. Even minor shifts in sentiment have led to significant changes, with markets rapidly oscillating between risk-on and risk-off positioning in response to incoming headlines.
World Currencies
The USD recorded its strongest month since July 2025, as investors moved into the safe-haven currency amid escalating conflict in the Middle East. Oil shocks from the conflict have further supported the dollar, given the U.S.’s position as a major energy producer. At the same time, some investors are concerned that prolonged geopolitical tensions could accelerate efforts by other countries to reduce reliance on the U.S. dollar and broader financial system over the long term.
Table 3: World Currencies Performance (Month-to-Date)
| USD | EUR | GBP | JPY | CAD | |
|---|---|---|---|---|---|
| USD | 2.7% | 1.8% | 2.1% | 2.2% | |
| EUR | -2.6% | -0.9% | -0.6% | -0.5% | |
| GBP | -1.8% | 0.9% | 0.3% | 0.4% | |
| JPY | -2.0% | 0.6% | -0.3% | 0.1% | |
| CAD | -2.1% | 0.5% | -0.4% | -0.1% |
Source: Koyfin
In contrast, other currencies have come under pressure. Europe, which relies heavily on energy imports from the Middle East, has seen the euro weaken. The Japanese yen slid past 160 per dollar, its weakest level since July 2025. Low domestic interest rates, combined with the need to sell yen to finance energy imports, have placed sustained downward pressure on the currency.
Real-World Assets (RWA) Outlook
RAAC backs its financial products with real-world assets (RWA), offering greater stability. The following section reviews the current market performance of each underlying asset.
Real Estate Environment
New home construction in the U.S. improved for the third straight month, rising by 7.2% in January. This increase was driven by multifamily construction, which rose by 30%, while single-family home construction declined due to cold weather. Newly issued building permits also declined.
The CPI shelter index increased by 3.0% annually, at a higher rate than other components, indicating persistent upward pressure. Overall, the housing market is improving slightly but remains fragile.
Fannie Mae and Freddie Mac are purchasing large amounts of mortgage-backed securities (MBS) under government direction. They plan to buy $200 billion worth of MBS to stabilize housing markets and reduce rising mortgage rates. While these actions may help, global market volatility and the potential for rising interest rates limit how much they can offset mortgage costs.
Commodities overview
Oil prices reached multi-year highs, surging to $112 per barrel, as the Middle East conflict disrupted shipments through the Strait of Hormuz, one of the world’s most critical oil transit routes, accounting for roughly 20% of global supply. Elevated oil prices are inherently inflationary, increasing costs across transportation, manufacturing, and food production. While prices briefly fluctuated on optimism surrounding a potential ceasefire and reduced supply disruptions, they continued to trend upward as markets priced in the risk of a prolonged supply shock.
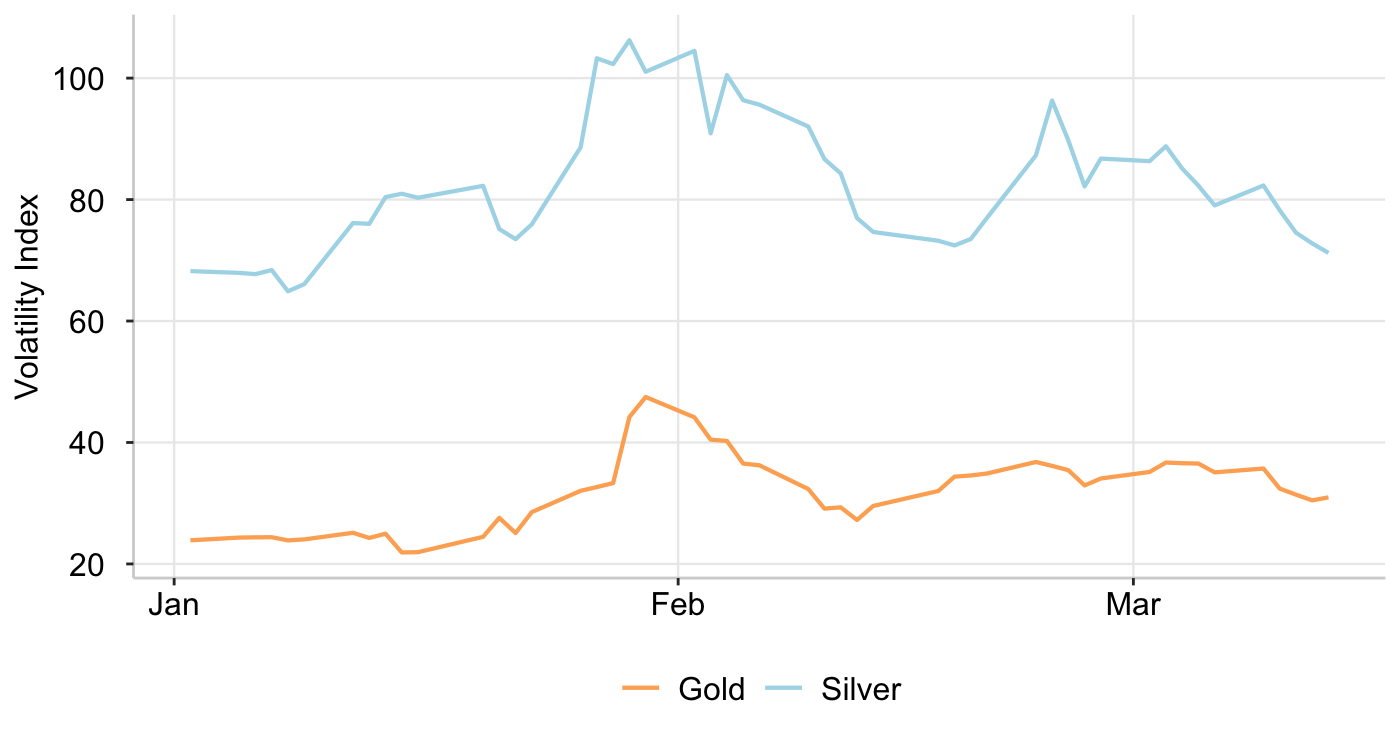
Gold initially rose to $5,339 at the onset of the U.S./Israel–Iran conflict, driven by increased demand for safe-haven assets. Throughout the month, however, gold prices fluctuated as investors balanced two opposing forces: inflation and high interest rates. While higher inflation enhances gold’s appeal as a store of value, expectations of elevated interest rates strengthen the U.S. dollar and increase bond yields, making other assets relatively more attractive than non-yielding gold.
Graph 4: CBOE Gold/Silver ETF Volatility Index
Source: CBOE
Gold declined by 13% over the month, behaving more like a pro-cyclical risk asset, with prices falling to a low of $4,375 per ounce. While this dynamic can occur during broad risk-off episodes, the magnitude of the decline was amplified by the strong momentum gold had built over the previous six months. The selloff may also reflect investors liquidating positions to meet margin requirements elsewhere. Despite this, gold continues to serve as a hedge against systemic risk.
Silver traded within a wide range, reaching a high of $90 per ounce and a low of $67 per ounce. The metal has exhibited significant volatility this year, with prices previously surging 70% due to speculative demand before correcting sharply. More recently, silver has found support from ongoing geopolitical tensions and strong demand from China, which has purchased over 790 tons from global markets in the past two months.
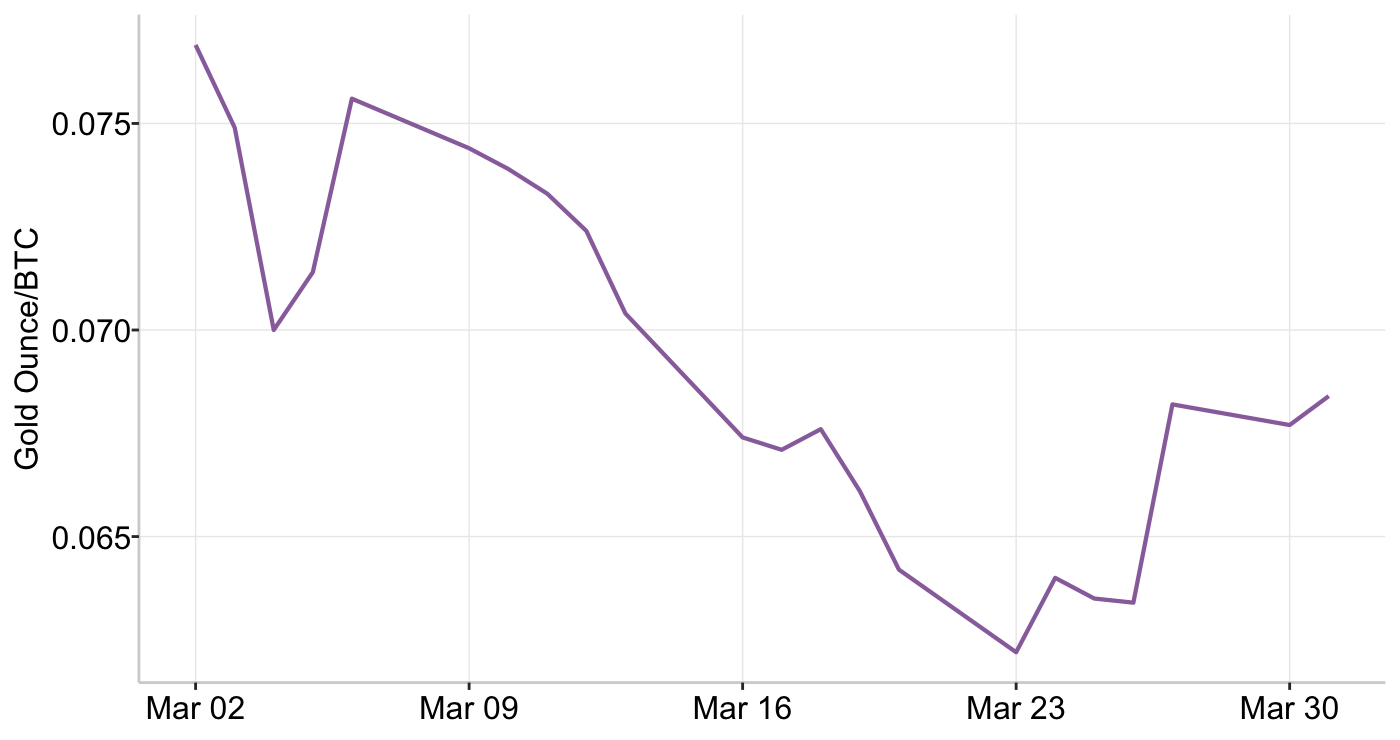
The gold-to-Bitcoin ratio indicates how many ounces of gold are needed to buy one Bitcoin (BTC), providing a comparison between a traditional store of value and a crypto-native risk asset. A rising ratio signals that gold is outperforming Bitcoin.
Graph 5: Gold Ounce/BTC
Source: Kofin
Bitcoin gained relative strength over this period, moving in line with broader technology rallies as gold underperformed amid a strong U.S. dollar, rising bond yields, and investor liquidity needs. This reflects a persistent preference for Bitcoin over gold in relative terms until the end of the month, when demand for gold increased.
Decentralized Finance (DeFi) Outlook
Cryptocurrencies
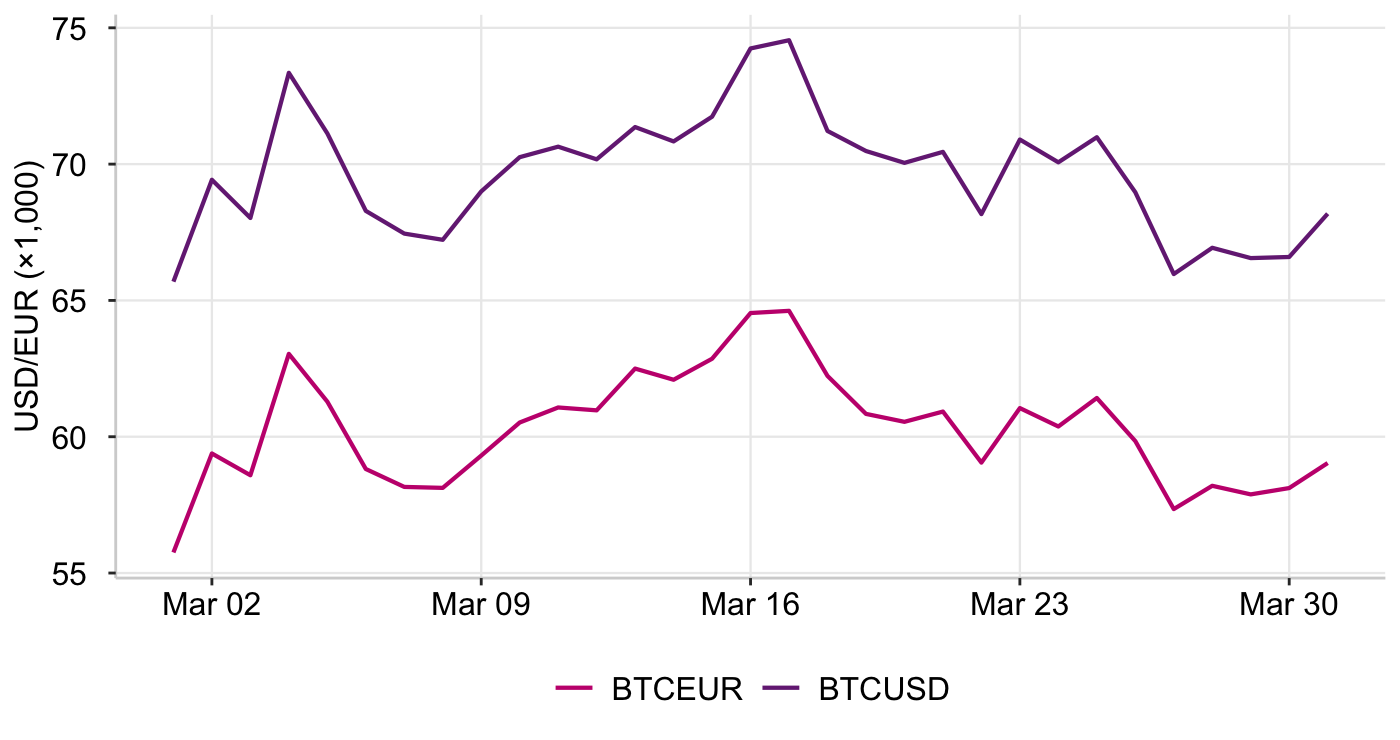
Bitcoin (BTC) has remained volatile amid uncertainty from developments in the Middle East, as investors rapidly adjust to shifting geopolitical conditions. It has also been trading in line with equities, exhibiting a relatively high correlation of 0.74, and behaving like a macro-sensitive asset than an independent hedge. Both Bitcoin and Ethereum (ETH) initially declined as investors reduced exposure to higher-risk assets, but later recovered alongside a broader technology-driven rally that improved risk appetite.
Graph 6: Bitcoin vs USD/EUR
Source: Koyfin
Bitcoin traded within a range of $65,689 to $74,545 USD. Its price is currently near the 200-week moving average, a level often viewed as a potential accumulation zone for long-term investors. Overall, BTC is up 4% over the month, but remains approximately 45% below its previous peak, due to weakening ETF inflows and continued market caution.
Stablecoins
Stablecoins are cryptocurrencies that are commonly held because they offer lower volatility than Bitcoin and Ethereum, allowing users to preserve capital while remaining active on-chain. RAAC issues its own stablecoin, Precious-Metal USD (pmUSD), which operates on the Ethereum blockchain.
The Ethereum network hosts approximately $163 billion in stablecoin supply, representing roughly 52% of the global market, and continues to serve as the dominant blockchain for stablecoin issuance and activity.
U.S. dollar–pegged stablecoins remain the largest within the ecosystem. Tether (USDT) holds the largest market capitalization at approximately $184 billion, while USD Coin (USDC) follows at around $77 billion.
Digital currency payments processed $350 billion in volume last year, highlighting the growing role of stablecoins as a global payment method. This expansion has attracted traditional financial institutions, which are increasingly entering the space through strategic acquisitions and partnerships. Mastercard is acquiring BVNK, a stablecoin payments infrastructure company, for up to $1.8 billion, marking one of the largest traditional finance moves into crypto infrastructure. At the same time, Nasdaq Inc. has partnered with Payward to develop blockchain-based tokenized equities. It also plans to connect its European exchanges to Seturion, enabling tokenized securities to trade more seamlessly across the region.
This signals growing integration between traditional finance and blockchain technology. Moreover, U.S. lawmakers have reached a major compromise on the CLARITY Act, banning passive yields on stablecoins, but allowing activity-based rewards derived from financial transactions.
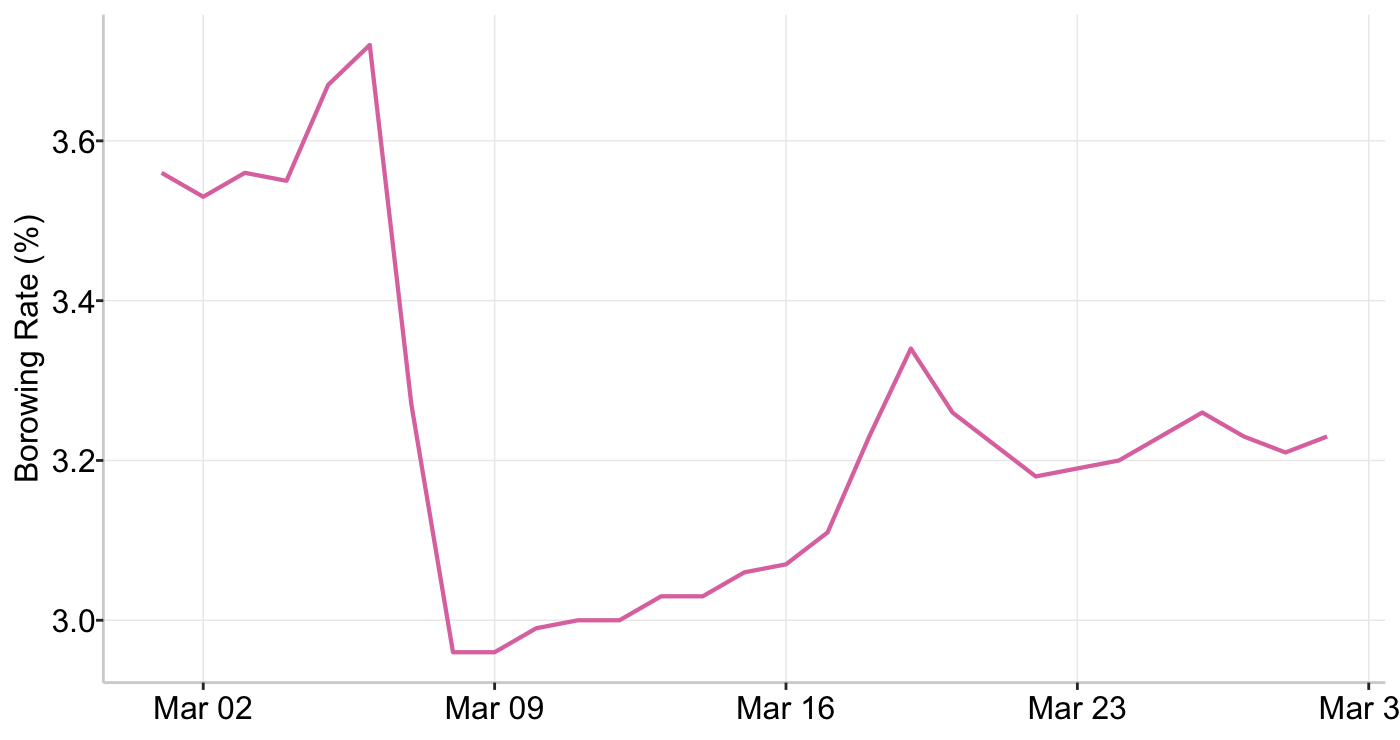
The Ethereum stablecoin borrowing rate represents the average cost of borrowing across lending protocols on the Ethereum network.
Graph 7: Ethereum Stablecoin Borrowing Rate
Source: Blockworks
The Ethereum stablecoin borrowing rate sharply declined from 3.72% to 3.27%, suggesting a decline in borrowing demand due to a potential risk-off sentiment. However, it did stabilize and later trended higher as market conditions improved and borrowing activity gradually recovered.
Glimpse into the Curve-Convex Ecosystems
RAAC is built directly within the Curve Finance (CRV) ecosystem and leverages Convex Finance (CVX) to enhance yield efficiency, strengthen governance influence, and direct liquidity toward its pools.
The Curve Wars refer to the competition to control voting power within Curve Finance. By locking CRV tokens, holders receive vote-escrowed CRV (veCRV), which grants voting rights to determine which liquidity pools receive reward emissions, ultimately influencing yield levels and liquidity depth. Protocols such as Convex have accumulated significant amounts of veCRV and provide incentives to voters to allocate emissions toward their preferred pools.
Currently, Convex governs approximately 419.9 million veCRV, representing about 53.7% of the total voting supply. The following section provides a more detailed breakdown of Convex’s role and underlying mechanics within the Curve ecosystem.
Table 4: CVX Breakdown - January 31, 2026
| Assets locked in Convex forever | |||||
|---|---|---|---|---|---|
| Token | Locked | $/vlCVX | Price | ||
 CRV CRV |
422,649,296 | 1.87 | $0.21 | ||
 FXS FXS |
7,455,860 | 0.06 | $0.42 | ||
 FXN FXN |
140,462 | 0.04 | $13.29 | Emissions controlled by vlCVX | |
 RSUP RSUP |
3,950,688 | 0.01 | $0.13 | 2w Emissions | $/2w/vlCVX |
 veCRV veCRV |
--- | --- | --- | 2,395,032 | $0.0106 |
 vlCVX vlCVX |
47,983,493 | --- | $1.73 | --- | $0.0111 |
Source: buycvxcorrect.netlify.app
From the table above, it can be inferred that paying $1.73 for vlCVX provides voting power equivalent to $1.87 of CRV, making it a more capital-efficient method of accumulating liquidity influence. As a result, RAAC’s strategy focuses on controlling voting power through the acquisition of Convex Finance (CVX) rather than directly purchasing Curve Finance (CRV).
The Kingmaker Ratio is a RAAC-specific metric designed to evaluate whether acquiring veCRV directly or accumulating vlCVX is the more efficient strategy for directing liquidity toward pmUSD on Curve. Using the locked balances and market prices of veCRV and vlCVX shown in Table 4, the leverage earned per dollar can be calculated as:
Kingmaker Ratio = veCRV/$ via CVXveCRV/$ via CRV
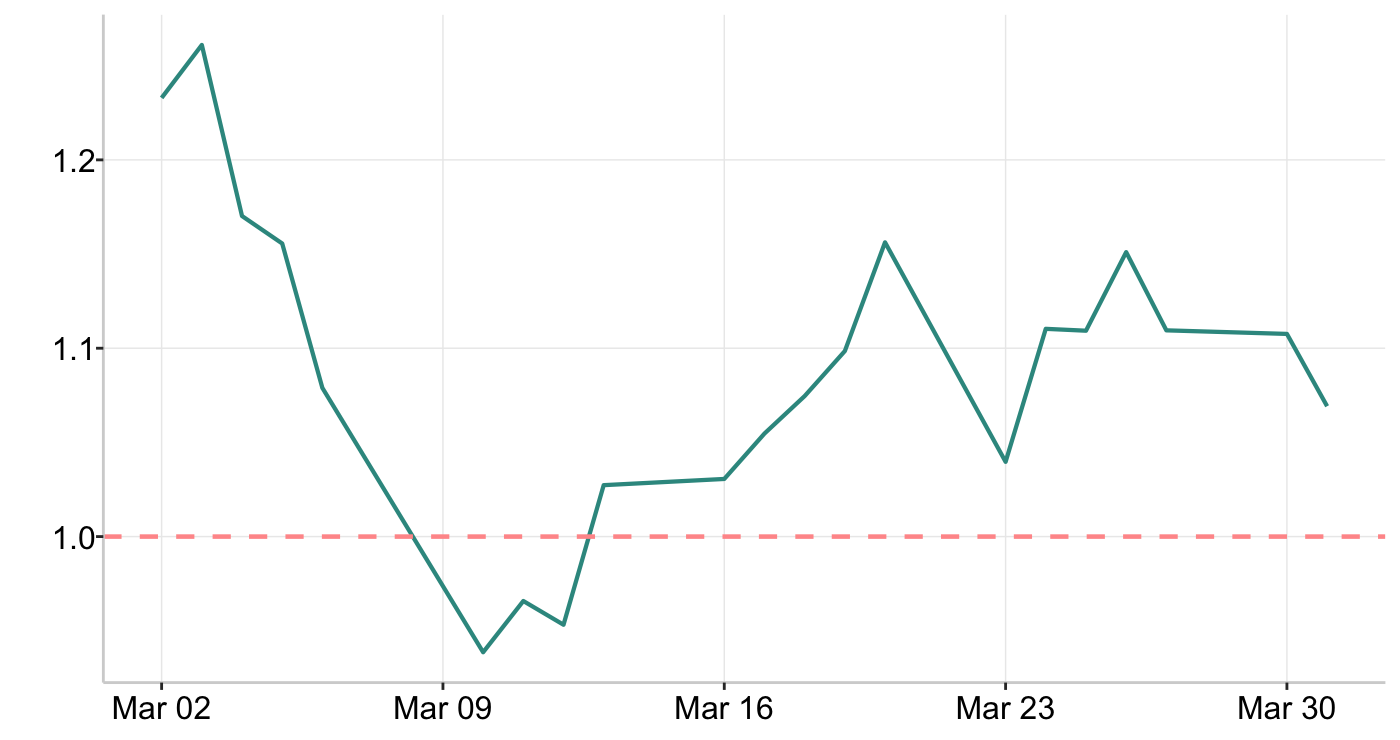
A ratio greater than one indicates capital efficiency through vlCVX, while a ratio below one suggests that direct veCRV accumulation is more efficient. Graph 8 tracks the evolution of this ratio throughout the month of march.
Graph 8: Kingmaker Ratio
Source: buycvxcorrect.netlify.app
Towards the beginning of the month, the ratio experienced a sharp decline and fell below the threshold of 1, indicating that accumulating veCRV directly was more efficient for a brief period of three days. However, the ratio quickly recovered and remained above 1, reinforcing that purchasing vlCVX is the more effective strategy for gaining governance power.
Using this strategy, RAAC has accumulated a substantial vlCVX position and now indirectly controls approximately 4.1% of Curve Finance’s voting power, making it the fourth-largest governance participant. This level of influence allows RAAC to consistently direct emissions toward its liquidity pools.
RAAC Outlook
Precious-Metal USD (pmUSD)
Precious-Metal USD (pmUSD) is RAAC’s stablecoin built on the Ethereum network. It officially launched at the beginning of 2026 and completed its first bond issuance on February 16, 2026, through a partnership with ApeBond. pmUSD is backed by gold assets supplied by RAAC’s partner, I-ON Digital. The stablecoin was designed to provide investors with exposure to a gold-backed digital asset within the broader crypto ecosystem.
I-ON Digital executed a $1.2 million corporate debt settlement using pmUSD, demonstrating the stablecoin as a credible instrument for traditional financial payments.
The table below highlights monthly changes in market capitalization for RAAC’s pmUSD compared to other relevant stablecoins.
Table 5: 1 Month Market Capitalization
| Stablecoin | Position | Market Capitalization |
|---|---|---|
 pmUSD pmUSD |
52 | $100.2M |
 USDT USDT |
1 | $184.03B |
 USDC USDC |
2 | $77.361B |
 PYUSD PYUSD |
7 | $3.489B |
 crvUSD crvUSD |
30 | $251.05M |
 frxUSD frxUSD |
45 | $120.93M |
 OUSD OUSD |
140 | $7.55M |
Source: DefiLlama
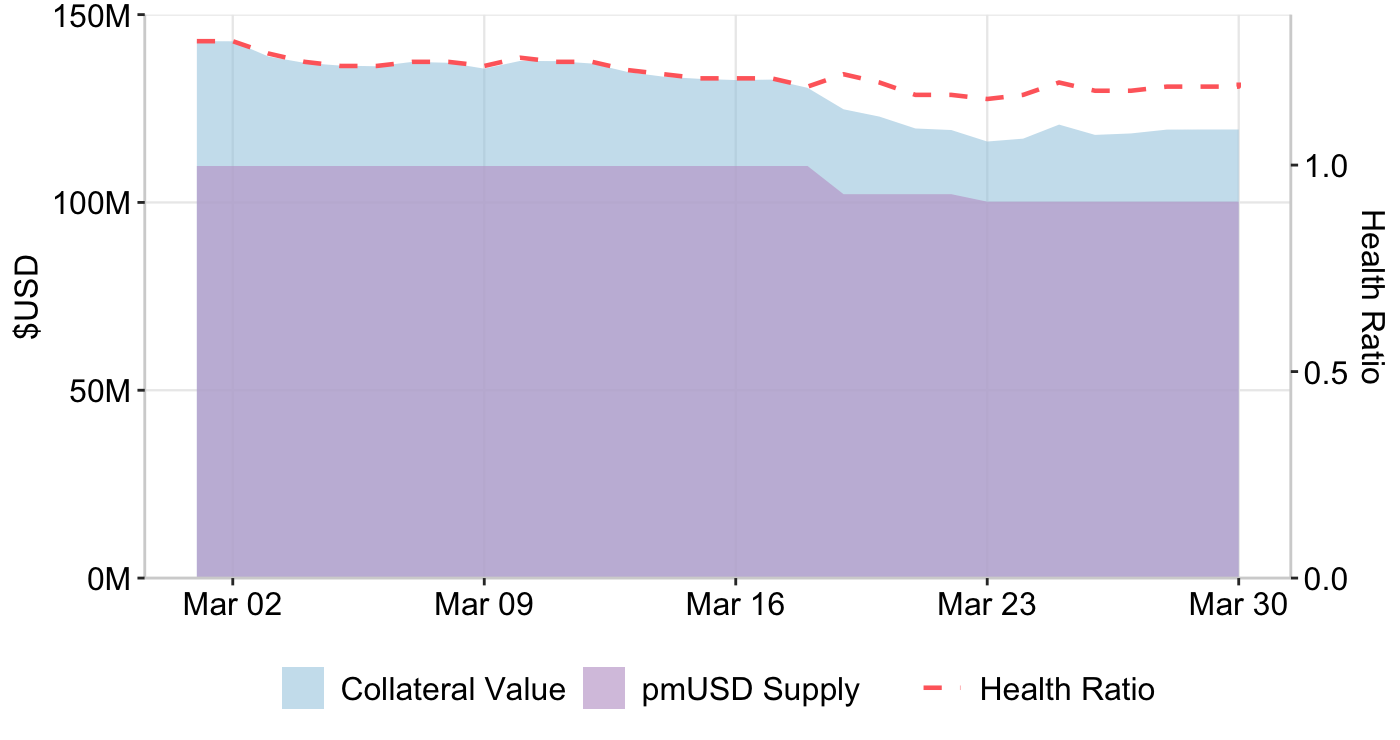
Currently, pmUSD has a $100.20 million units outstanding, ranking it as the 52nd largest stablecoin. This is a decline from the previous month due to RAAC’s active management of pmUSD supply in response to changes in gold collateral values.
As the value of the collateral declined, RAAC burned $9.5M of pmUSD to maintain a stable health ratio and preserve overcollateralization. This reduced the pmUSD supply from $109M to $100M. Of the burned pmUSD, $3.5M was reallocated into iREET.
Table 9: Collateral vs pmUSD supply
Source: https://dune.com/4sh4/raac-pmusd
iREET
Index Real Estate Token (iREET) is a tokenized real estate index that provides users with exposure to a diversified portfolio of properties through a single token. The product functions similarly to a traditional real estate investment trust (REIT), but offers enhanced liquidity through blockchain infrastructure.
RAAC acquires properties using cash, meaning changes in mortgage rates do not directly affect its acquisition strategy or cost of capital. However, elevated shelter inflation indicates that housing prices and rents remain high, reinforcing the importance of selective property acquisition.
iREET launched on March 11, 2026, with five income-generating properties valued at approximately $1.3 million, establishing an initial token supply of 1.33 million. Currently, iREET is accessible via the iREET/pmUSD liquidity pool on Curve, with additional yield integrations expected soon. Moreover, non-fungible tokens (NFTs) will be created for each property.
Liquidity pools
RAAC has 4 liquidity pools active on Curve Finance:
- pmUSD/crvUSD - Launched Dec 25, 2025
- pmUSD/frxUSD - Launched Dec 25, 2025
- pmUSD/OUSD - Launched Feb 28, 2026
- iREET/pmUSD - Launched Mar 12, 2026
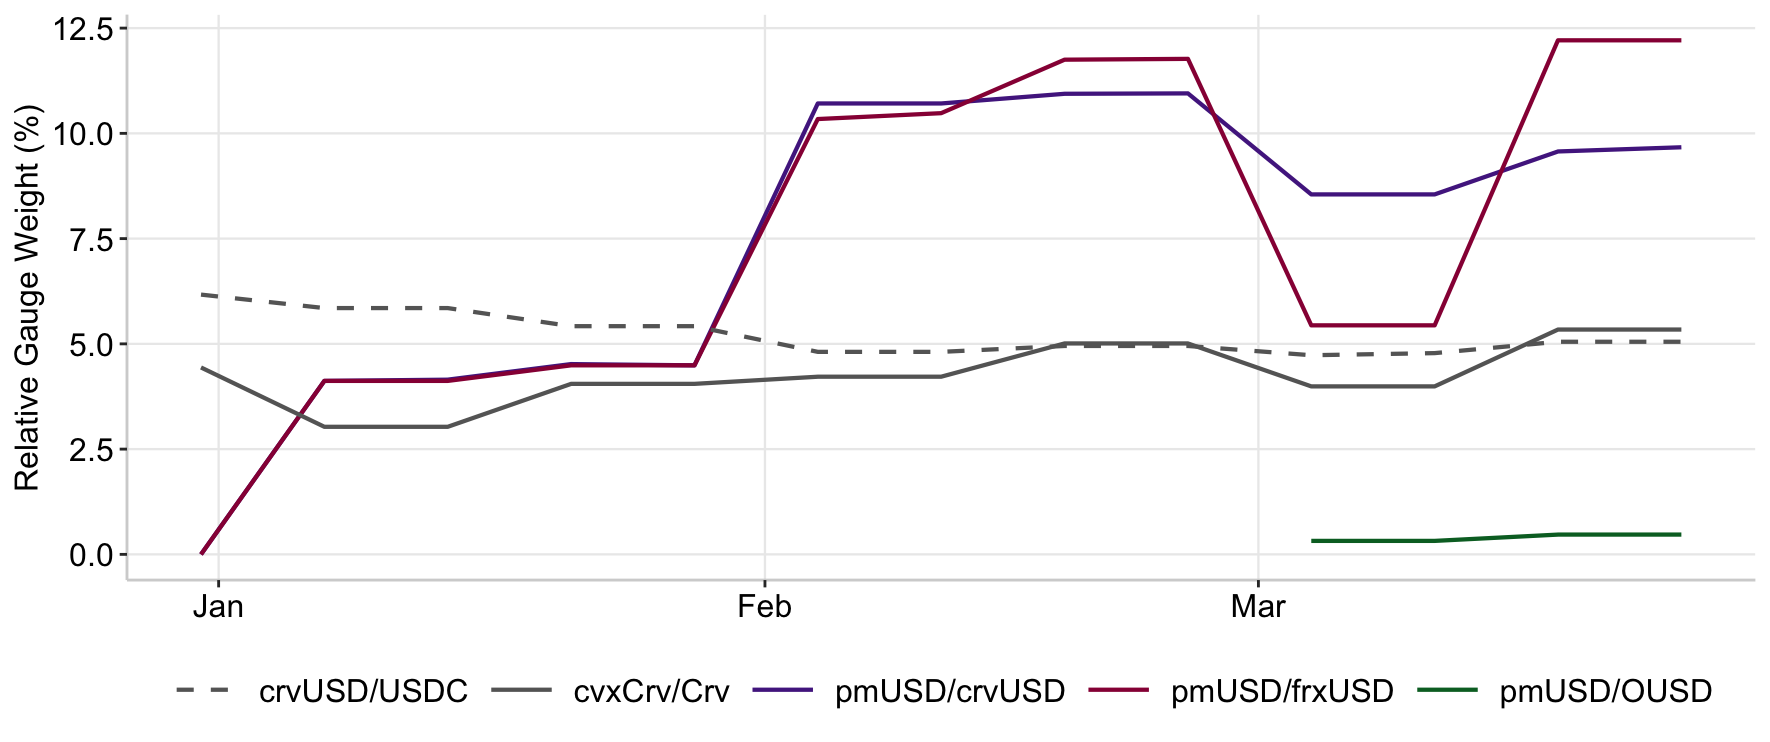
RAAC is built on the existing Curve Finance infrastructure and ecosystem, including active participation in the Curve Wars. Through this participation, RAAC has directed liquidity to its Curve pools. Graph 9 illustrates the relative gauge weight of the top liquidity pools on Curve Finance. Currently, pmUSD/crvUSD holds 9.67% of emission shares, while pmUSD/frxUSD holds 12.21%.
Graph 10: Top Curve Gauges
 Source: curve.finance
pmUSD/crvUSD and pmUSD/frxUSD continue to receive the highest vote allocations relative to competing pools. RAAC’s substantial voting influence allows it to consistently direct emissions toward its own liquidity pools.
This creates a structural advantage by enabling RAAC to offer sustainable and predictable yields. As a result, users can participate in RAAC products with long-term confidence, supported by both strong asset backing and governance power.
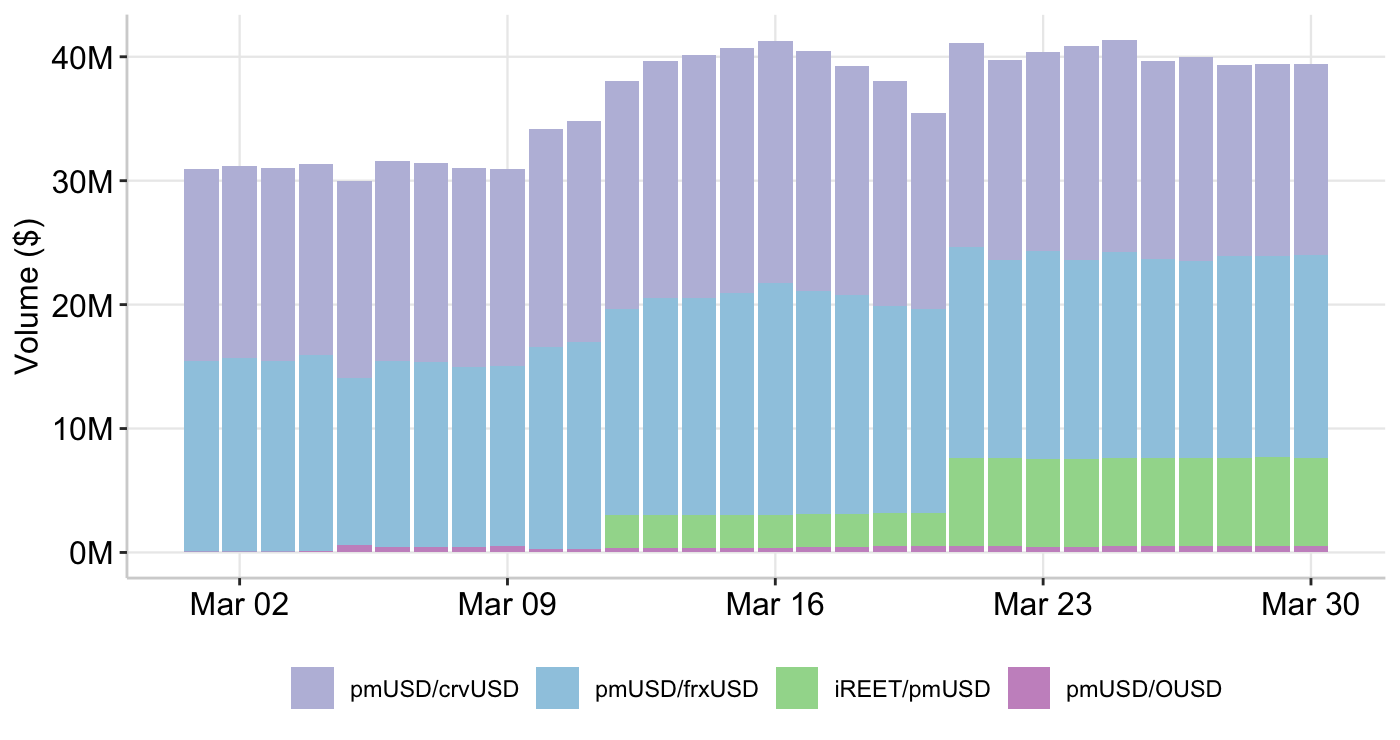
The pools maintain strong liquidity, with a combined TVL of $40 million, indicating increasing adoption of pmUSD. The pmUSD/crvUSD pool drives most activity, while pmUSD/frxUSD provides consistent secondary volume, helping deepen overall market liquidity. pmUSD/OUSD and iREET/pmUSD are newer and smaller pools, but their presence reflects ecosystem expansion and diversification.
Graph 11: RAAC Curve Pools - Total Volume Locked (TVL)
Source: https://dune.com/4sh4/raac-pmusd
Liquidity providers benefit from strong incentive structures. pmUSD/crvUSD and pmUSD/frxUSD maintain deep liquidity for stable trading, while pmUSD/OUSD offers enhanced yield opportunities for participants seeking higher returns.
Table 7: Curve Pools - March 31, 2026
| Pool | Base vAPY | Rewards tAPR CRV + Incentives | TVL |
|---|---|---|---|
  pmUSD/crvUSD pmUSD/crvUSD |
0.01% | 7.19% → 17.99% CRV | $15.34M |
  pmUSD/frxUSD pmUSD/frxUSD |
0.0% | 8.26% → 20.66% CRV | $16.28M |
  pmUSD/OUSD pmUSD/OUSD |
0.01% | 12.58% → 31.46% CRV | $524.67K |
  iREET/pmUSD iREET/pmUSD |
0.0% | --- | $7.10M |
Source: curve.finance
In addition, participants can further enhance yields by depositing LP tokens into protocols such as Stake DAO, Convex Finance, Beefy Finance, and Yearn Finance to access boosted rewards. Table 8 provides a detailed breakdown of available yield opportunities.
Table 8: Boosted Yields Opportunities for pmUSD - March 31, 2026
| Protocol | Pool Yields | ||
|---|---|---|---|
  pmUSD/crvUSD pmUSD/crvUSD |
  pmUSD/frxUSD pmUSD/frxUSD |
  pmUSD/OUSD pmUSD/OUSD |
|
 Convex Convex |
16.36% (proj. 17.08%) | 17.18% (proj. 19.86%) | 19.37% (proj. 26.26%) |
 Stake DAO Stake DAO |
21.64% | 22.95% | 18.27% |
 Beefy Beefy |
26.78% | 27.78% | 17.97% |
 Yearn Yearn |
--- | 24.30% | --- |
Source: curve.convexfinance, stakedao, app.beefy, yearn.fi
Notes: data is exported on the last day of the month.
RAAC has also partnered with Royco Protocol to further expand return opportunities for participants. Royco functions as a borrowing and lending protocol, where the borrowing APY stands at 3.17% and the supply rate at 2.88%, providing additional flexibility for capital deployment within the ecosystem.
Tokenized Commodities
Tokenized gold provides direct exposure to gold and has expanded significantly over the past year due to rising gold prices and macroeconomic uncertainty. Tether Gold (XAUT) leads issuance on the Ethereum network at approximately $2.5 billion, followed closely by PAXG at $2.3 billion.
Table 9: Market Capitalization of Tokenized Gold on Ethereum
| Tokenized Gold | March 2025 | March 2026 |
|---|---|---|
 XAUT XAUT |
$557,944,866 | $2,570,548,676 |
 PAXG PAXG |
$669,945,537 | $2,298,784,950 |
 XAUm XAUm |
$3,568,928 | $24,851,945 |
Source: rwa.xyz
Notes: data is exported on the last day of the month.
The growth in issuance reflects increasing demand for blockchain-based real-world assets and reinforces the opportunity for RAAC to introduce its own gold-backed token.
Resources
Data
https://tradingeconomics.com/indicators
https://truflation.com/marketplace/us-inflation-rate
https://fred.stlouisfed.org/series/PRIME
https://fred.stlouisfed.org/series/MORTGAGE30US
https://app.koyfin.com/gyld
https://fred.stlouisfed.org/series/DGS10
https://fred.stlouisfed.org/series/BAMLC0A0CM#
https://fred.stlouisfed.org/series/WM2NS
https://fred.stlouisfed.org/series/VIXCLS
https://finviz.com/crypto_charts.ashx?t=ETHUSD&p=d
https://finviz.com/crypto_charts.ashx?t=BTCUSD&r=m1&ty=l&ta=0&p=d
https://defillama.com/stablecoins
https://www.coingecko.com/en/coins/curve-dao-token
https://defillama.com/protocol/yields/uniswap
https://defillama.com/protocol/yields/curve-finance
https://defillama.com/protocol/treasury/raac
https://www.coingecko.com/en/coins/convex-finance
https://defillama.com/protocol/convex-finance
https://www.cboe.com/us/indices/dashboard/ovx-GVZ/
https://app.koyfin.com/charts/g/fx-faleqt
https://app.koyfin.com/charts/g/fx-32ha89
https://app.koyfin.com/charts/g/ft-gt3aj0
https://www.cboe.com/us/indices/dashboard/ovx/
https://app.rwa.xyz/commodities
https://www.convexfinance.com/
https://www.curve.finance/dao/ethereum/gauges
https://www.curve.finance/dex/ethereum/pools?search=pmusd
https://www.stakedao.org/yield?search=pmusd
https://curve.convexfinance.com/stake
https://app.beefy.com/
https://yearn.fi/vaults?type=lp&search=pmusd
https://app.gearbox.finance/strategies/open/1/0x1774a6b4aba3b999461a1682f6776cac66dd1987
https://app.morpho.org/ethereum/market/0x72cc79433e9f91c2a185422725510f4bdd19c9006010f464f851468b2371b756/srroyusdc-pmusd?tab=market#advanced
News
https://www.bloomberg.com/news/articles/2026-03-01/dollar-surges-as-traders-brace-for-war-impact-markets-wrap
https://www.bloomberg.com/news/articles/2026-03-02/gold-rises-as-escalating-conflict-in-middle-east-stokes-demand
https://www.bloomberg.com/news/articles/2026-03-02/asia-poised-for-weak-open-after-treasuries-sink-markets-wrap
https://www.bloomberg.com/news/articles/2026-03-05/dollar-eyes-best-week-since-2022-as-jobs-data-looms?srnd=phx-markets
https://www.bloomberg.com/news/articles/2026-03-05/bond-traders-see-increasing-chance-of-no-fed-cuts-this-year?srnd=phx-markets
https://www.bloomberg.com/news/articles/2026-03-04/stock-market-today-dow-s-p-live-updates-?srnd=phx-markets
https://www.bloomberg.com/news/articles/2026-03-05/bitcoin-btc-holds-firm-above-70-000-as-global-assets-recover
https://www.bloomberg.com/news/articles/2026-03-05/asian-stocks-to-fall-oil-climbs-as-conflict-rages-markets-wrap
https://www.bloomberg.com/news/articles/2026-03-09/stagflation-trades-sweep-markets-as-trump-signals-widening-war
https://www.bloomberg.com/news/articles/2026-03-08/oil-tops-100-as-war-rages-stocks-set-to-fall-markets-wrap
https://www.bloomberg.com/news/articles/2026-03-09/oil-drops-as-trump-signals-iran-conflict-near-end-markets-wrap https://www.bloomberg.com/news/articles/2026-03-11/us-core-inflation-slowed-as-expected-before-war-with-iran
https://www.bloomberg.com/news/articles/2026-03-11/stock-market-today-dow-s-p-live-updates-
https://www.bloomberg.com/news/articles/2026-03-12/traders-are-no-longer-fully-pricing-in-a-fed-rate-cut-this-year
https://www.bloomberg.com/news/articles/2026-03-15/oil-supplies-in-focus-ahead-of-stock-bond-open-markets-wrap
https://www.bloomberg.com/news/articles/2026-03-16/gold-steady-as-dollar-eases-and-traders-weigh-oil-supply-crunch
https://www.bloomberg.com/news/articles/2026-03-17/gold-holds-steady-near-5-000-as-traders-weigh-fed-rate-cut-path https://www.bloomberg.com/news/articles/2026-03-19/bond-traders-no-longer-price-in-any-chance-of-fed-cut-in-2026
https://www.bloomberg.com/news/articles/2026-03-19/stock-market-today-dow-s-p-live-updates-
https://www.bloomberg.com/news/articles/2026-03-20/china-pulls-silver-from-global-markets-to-meet-surging-demand
https://www.bloomberg.com/news/articles/2026-03-12/us-housing-starts-unexpectedly-climb-on-multi-family-projects
https://www.bloomberg.com/news/articles/2026-03-22/fannie-freddie-place-large-bids-for-mortgage-backed-securities
https://www.bloomberg.com/news/articles/2026-03-06/bitcoin-s-correlation-with-stocks-surges-as-volatility-returns
https://www.bloomberg.com/news/articles/2026-03-17/mastercard-to-buy-stablecoin-startup-bvnk-for-up-to-1-8-billion
https://www.bloomberg.com/news/articles/2026-03-09/nasdaq-plans-equity-token-design-partnering-with-kraken-parent
https://www.disruptionbanking.com/2026/03/22/clarity-act-unblocked-stablecoin-yield-compromise-reached/
https://www.bloomberg.com/news/articles/2026-03-22/markets-set-for-turbulent-open-as-war-rages-on-markets-wrap https://www.bloomberg.com/news/articles/2026-03-23/bitcoin-hits-two-week-low-as-war-tensions-fan-uncertainty
https://www.bloomberg.com/news/articles/2026-03-23/bitcoin-rises-after-trump-says-to-postpone-iran-strikes
https://www.bloomberg.com/news/articles/2026-03-22/gold-wavers-after-worst-week-in-four-decades-as-war-risks-mount https://www.bloomberg.com/news/articles/2026-03-24/stock-market-today-dow-s-p-live-updates
https://www.bloomberg.com/news/articles/2026-03-25/stock-market-today-dow-s-p-live-updates
https://www.bloomberg.com/news/articles/2026-03-26/trapped-in-private-credit-investors-wait-to-pull-out-5-billion
https://www.bloomberg.com/news/articles/2026-03-26/mortgage-rates-jump-to-6-38-as-war-rattles-housing-market
https://www.bloomberg.com/news/articles/2026-03-26/jpmorgan-plans-private-credit-fund-that-allows-7-5-redemptions
https://www.bloomberg.com/news/articles/2026-03-30/bonds-everywhere-are-rallying-as-global-slowdown-fears-intensify
https://www.bloomberg.com/news/articles/2026-03-31/dollar-wraps-up-best-month-since-2022-amid-war-in-middle-east
https://www.bloomberg.com/news/articles/2026-03-31/jpy-usd-why-is-japanese-yen-so-weak-and-will-the-government-intervene