
Overview
Macroeconomic & Traditional Finance Outlook
The federal funds rate remained unchanged as there was no FOMC meeting this month. Economic data has been mixed, with persistent inflationary pressures continuing to place significant upward pressure on Treasury yields. Corporate bond spreads tightened, as investors reassessed creditworthiness, while equity markets continue to push higher, led by large tech companies driving all-time highs this past month. The U.S. dollar has recently weakened as fading geopolitical tensions improved global risk sentiment. At the same time, many other currencies have also come under pressure as the war continues to create inflationary pressures and raise energy costs across the global economy.
Real-World Assets (RWA) Outlook
Oil prices remain elevated, and mortgage rates have climbed as rising treasury yields put affordability pressures on the housing market. Elevated treasury yields are also putting pressure on gold as investors rotate towards yield-bearing assets; however, central banks' gold accumulation signals long-term strength.
Decentralized Finance (DeFi) Outlook
Bitcoin is range-bound and losing institutional capital to safer alternatives, while the broader crypto market weakens from high bond yields pulling risk appetite away from speculative assets. The Ethereum stablecoin borrowing rate has moderated this month as risk sentiment has cooled. At the same time, countries and financial institutions around the world are competing to establish a presence in the growing stablecoin market.
RAAC Outlook
RAAC continues to maintain a healthy collateral ratio for pmUSD despite the recent decline in gold prices. The protocol also controls 4.49% of all veCRV voting power, enabling it to support competitive yields, with the weighted reward APY across RAAC’s Curve liquidity pools ranging from 5.5% to 63% over the month. Lastly, pmUSD physical gold redemptions have been announced, and the $iREET bonds have reached maturity, marking another important milestone for the ecosystem.
Macroeconomic & Traditional Finance Outlook
United States
There was no Federal Open Market Committee (FOMC) meeting this month, and the federal funds rate remained unchanged at 3.50%–3.75%. Economic data has been mixed, with CPI reaching its highest level since 2023 while the unemployment rate remained steady and the economy continued to add jobs.
Overall, the economy is not weak enough to justify rate cuts, but not strong enough to support further hikes, leaving the Federal Reserve in a policy stalemate. As a result, markets have repriced interest-rate expectations and are no longer anticipating rate cuts this year.
Table 1: US Indicators
| Indicator | Period | Actual | Previous | Consensus |
|---|---|---|---|---|
| GDP | Q1 | 1.6% | 0.5% | 2.0% |
| Unemployment | Apr | 4.3% | 4.3% | 4.3% |
| Core CPI (YoY) | Apr | 2.8% | 2.6% | 2.7% |
| 1YR Inflation Expectations | May | 4.8% | 4.7% | 4.5% |
Source: tradingeconomics
Notes: Headline CPI came in at 3.8%, the highest level since 2023, as inflationary pressures continue spreading through the economy due to oil supply constraints stemming from the U.S/Israel–Iran conflict. The Producer Price Index (PPI) recorded its largest increase since 2022, rising 6.0%. Meanwhile, Core Personal Consumption Expenditures (PCE), the Federal Reserve preferred inflation measure, came in at 3.3%, suggesting consumers are still spending, but at a slower pace. The unemployment rate held steady at 4.3%, while additional data showed the U.S. economy added 115K jobs, though wage growth continued to slow.
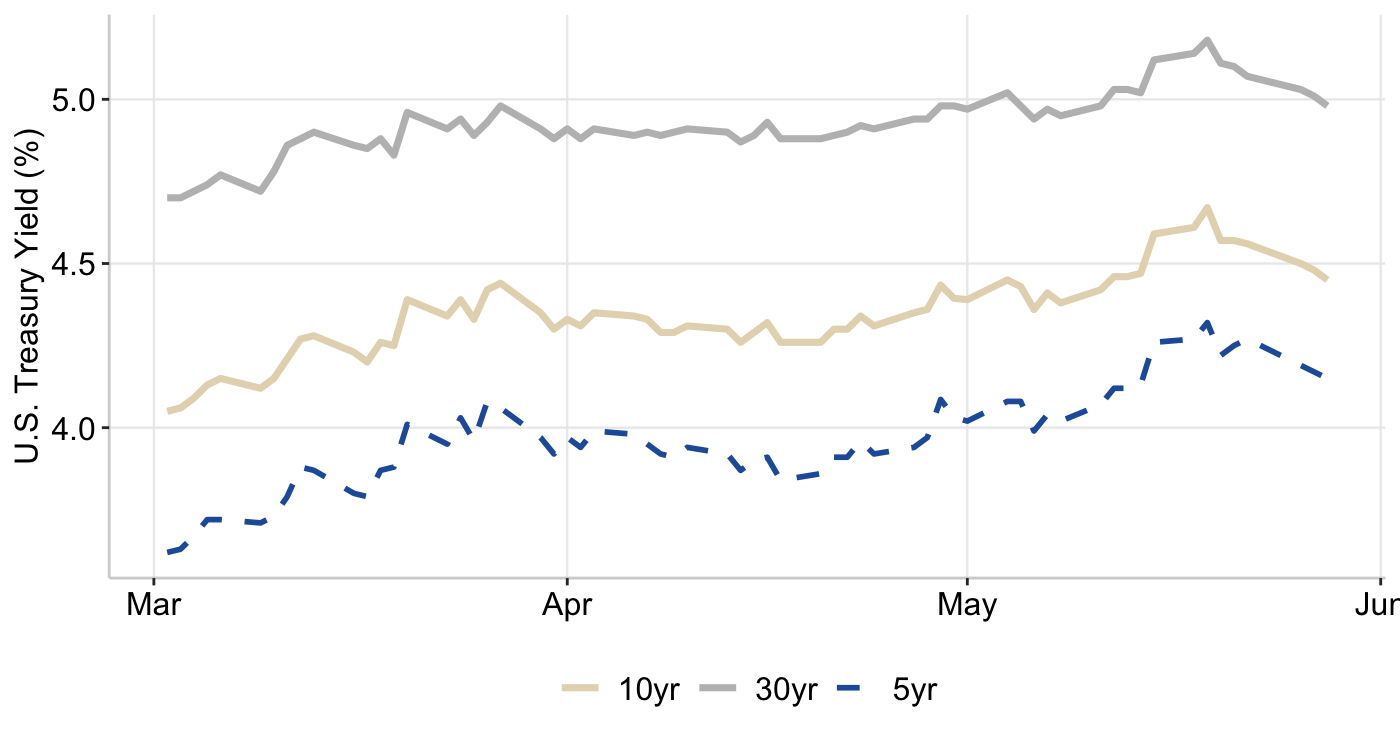
Treasury yields remained elevated throughout the month as rising oil prices and persistent global inflation concerns increased the attractiveness of government bonds as a risk-free alternative. The 10-year Treasury yield climbed to 4.67%, its highest level in over a year, as investors priced in tighter monetary policy. Meanwhile, the U.S. 30-year Treasury bond yield surpassed 5.046% for the first time since 2007, reflecting investors' demands for greater compensation against inflation risk. Markets were pricing in a new era of structurally higher bond yields and borrowing costs, as inflation continued to prove more persistent than previously expected.
Toward the end of the month, bond markets recovered as optimism surrounding a potential ceasefire supported a more dovish outlook. The yield curve also steepened, with the spread between 30-year and 5-year Treasury yields widening to approximately 82 basis points. This suggests investors are beginning to balance expectations of moderating inflation and lower future yields against ongoing economic and geopolitical uncertainty.
Graph 1: U.S. 5-Year, 10-Year, & 30-Year Treasury Yields
Source: FRED
Despite geopolitical tensions and concerns about prolonged inflation, strong corporate earnings, AI-driven optimism, and attractive yields above 5% are fueling heavy demand for investment-grade credit. As a result, corporate bond spreads have tightened from 0.81 to 0.73, as investors are demanding less compensation to hold corporate bonds. At the same time, government bonds are selling off due to inflation concerns and weakening confidence in sovereign balance sheets, leading investors to view some corporate firms as having stronger credit quality than certain sovereigns. However, current spreads may be overly optimistic, as markets could be underestimating the damage that persistently high oil prices may cause.
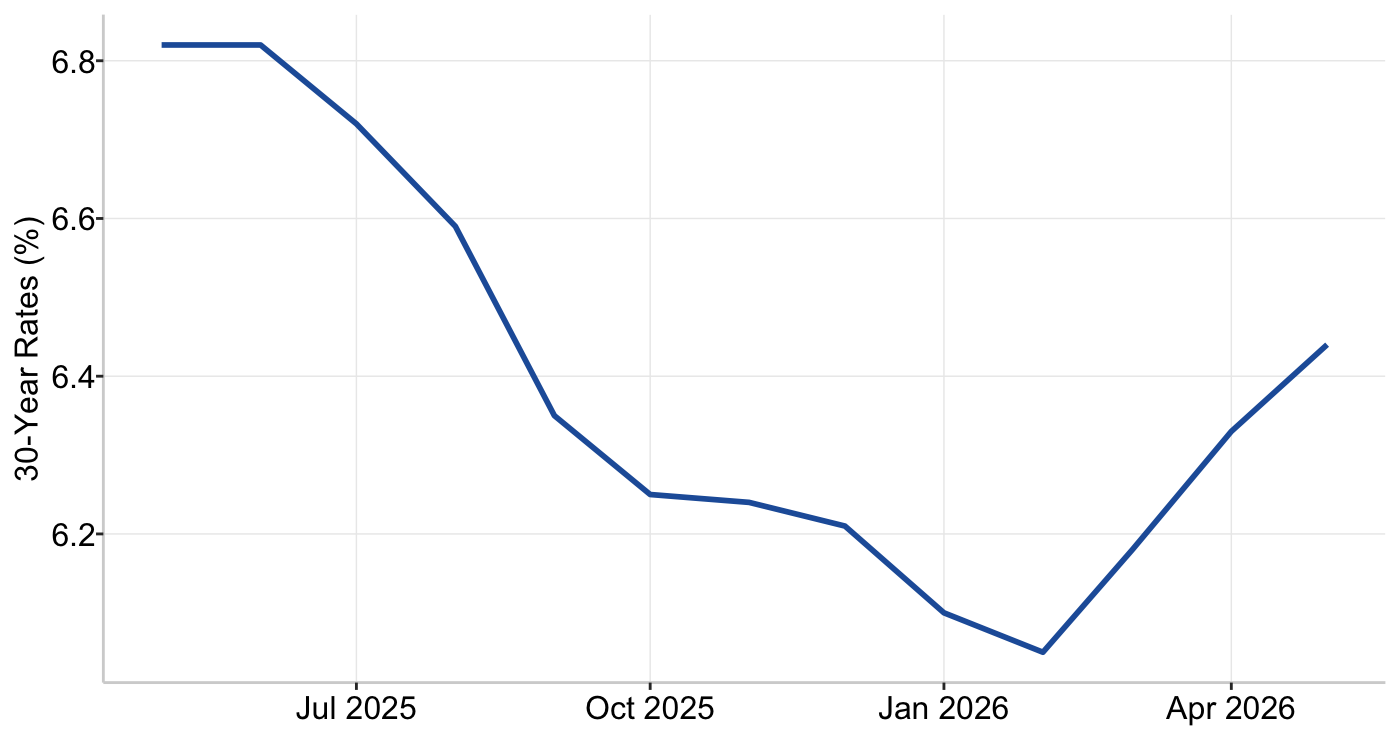
The average U.S. 30-year mortgage rate rose to 6.51%, the highest level since August 2025. While the housing market had begun to recover, rising Treasury yields driven by inflation concerns have increased financing costs and stalled that momentum. Housing demand still exists, as consumers continue to want homes, but affordability constraints are preventing many buyers from entering the market. The housing market is no longer driven solely by local housing conditions and is now being heavily influenced by broader geopolitical developments.
Graph 2: US 30-Year Mortgage Rates
Source: FRED
Equities
Markets recorded their ninth consecutive weekly gain this month, with both the S&P 500 and Nasdaq reaching new record highs of $7,580 and $26,972, respectively. Markets experienced significant whipsaw movements as investors reacted to conflicting headlines surrounding a potential U.S./Israel–Iran ceasefire. Despite the uncertainty, markets priced in a best-case scenario before any formal resolution occurred, with AI-driven earnings growth and FOMO (fear of missing out) continuing to fuel risk appetite.
U.S. equities continued to reach new all-time highs, led by large technology companies that are less exposed to oil prices, shipping disruptions, and commodity inflation. Companies such as Nvidia, Tesla, and Apple rallied strongly and helped push major indexes higher. Moreover, AI leaders were being viewed as defensive growth assets rather than traditional cyclical technology stocks, with Nvidia remaining the market leader.
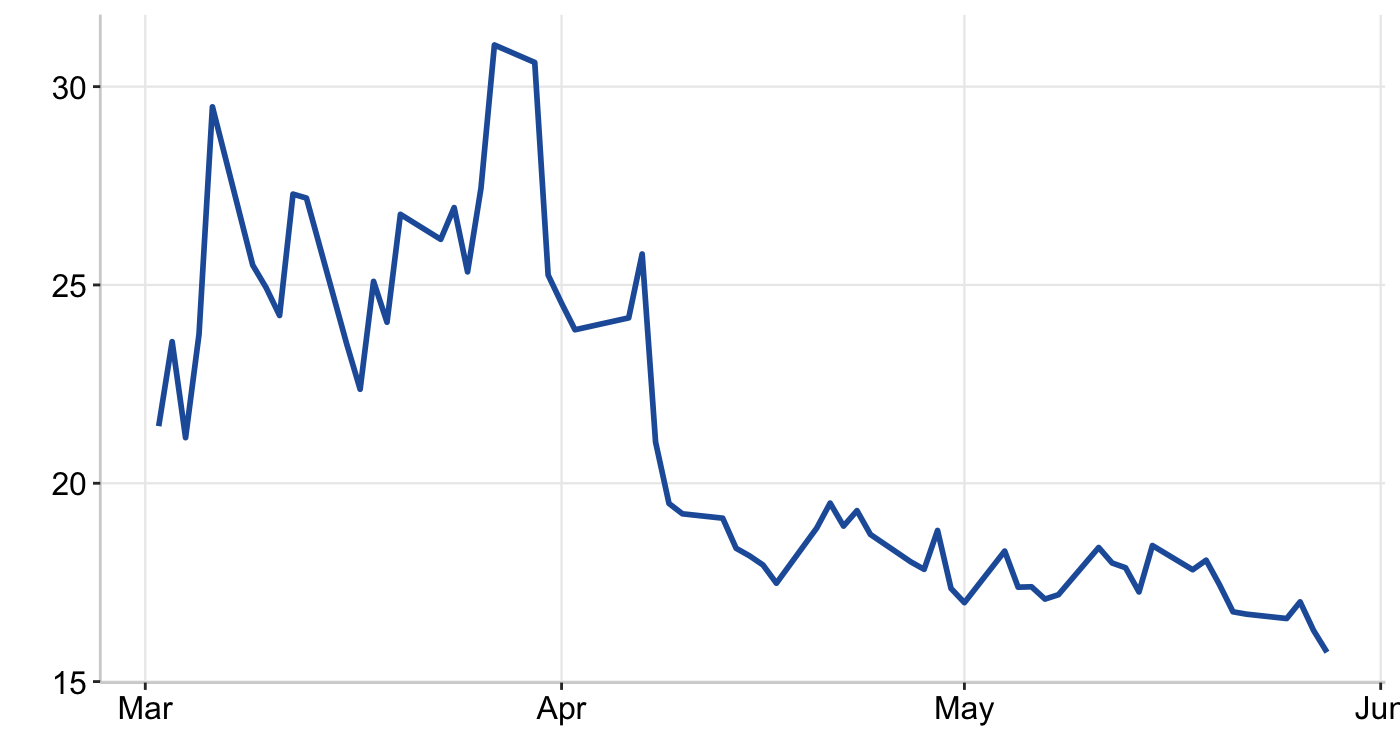
Graph 3: CBOE SPX Volatility Index
Source: FRED
However, markets did experience periods of weakness as elevated Treasury yields pressured equities. Higher yields increased borrowing costs, reduced the present value of future earnings, and made bonds more attractive relative to stocks. At the same time, technology and AI-related stocks have experienced substantial gains and now trade at elevated valuations, leaving investors focused on whether future earnings growth can justify current prices.
World Currencies
The U.S. dollar continues to act as a safe-haven asset, fluctuating alongside headlines surrounding the U.S./Israel–Iran conflict. The dollar has recently weakened as fading geopolitical tensions improved global risk appetite and shifted investors toward equities, international assets, and commodities. At the same time, the dollar’s long-term safe-haven status could be in question if U.S. deficits continue rising, as global markets may slowly stop treating U.S. Treasuries as unquestioned safe assets.
Table 2: World Currencies Performance (Month-to-Date)
| USD | EUR | GBP | JPY | CAD | |
|---|---|---|---|---|---|
| USD | 0.6% | 1.1% | 1.7% | 1.6% | |
| EUR | -0.6% | 0.5% | 1.1% | 1.0% | |
| GBP | -1.1% | -0.5% | 0.6% | 0.5% | |
| JPY | -1.7% | -1.1% | -0.6% | -0.1% | |
| CAD | -1.5% | -1.0% | -0.5% | 0.1% |
Source: Koyfin
The Japanese government has spent over $55 billion supporting the yen against the U.S. dollar. The yen has fallen to 160 JPY/USD, a level widely viewed as a major danger zone, with markets expecting government intervention. The weakness in the yen continues to be driven by the large interest rate differential between Japan and the U.S., which is pushing capital flows toward the dollar. The Iran conflict has triggered a sharp rise in oil prices, placing significant pressure on Asian emerging markets. Countries such as India, Indonesia, and the Philippines are experiencing currency weakness, rising bond yields, and capital outflows as inflationary pressures and import costs increase.
Real-World Assets (RWA) Outlook
RAAC backs its products with real-world assets (RWA), offering greater stability. The following section reviews the current market performance of each underlying asset.
Real Estate Environment
The U.S. spring housing market is weaker than normal, as high mortgage rates, elevated home prices, and uncertainty surrounding the U.S./Israel-Iran conflict are discouraging buyers. Home-buying activity has slowed, with mortgage applications falling by 4.1%, reflecting weakening housing demand due to affordability challenges. Although inventory levels have improved and price growth has moderated, there is still an overall shortage of available homes, and buyers are becoming selective about the properties they are willing to purchase.
Commodities overview
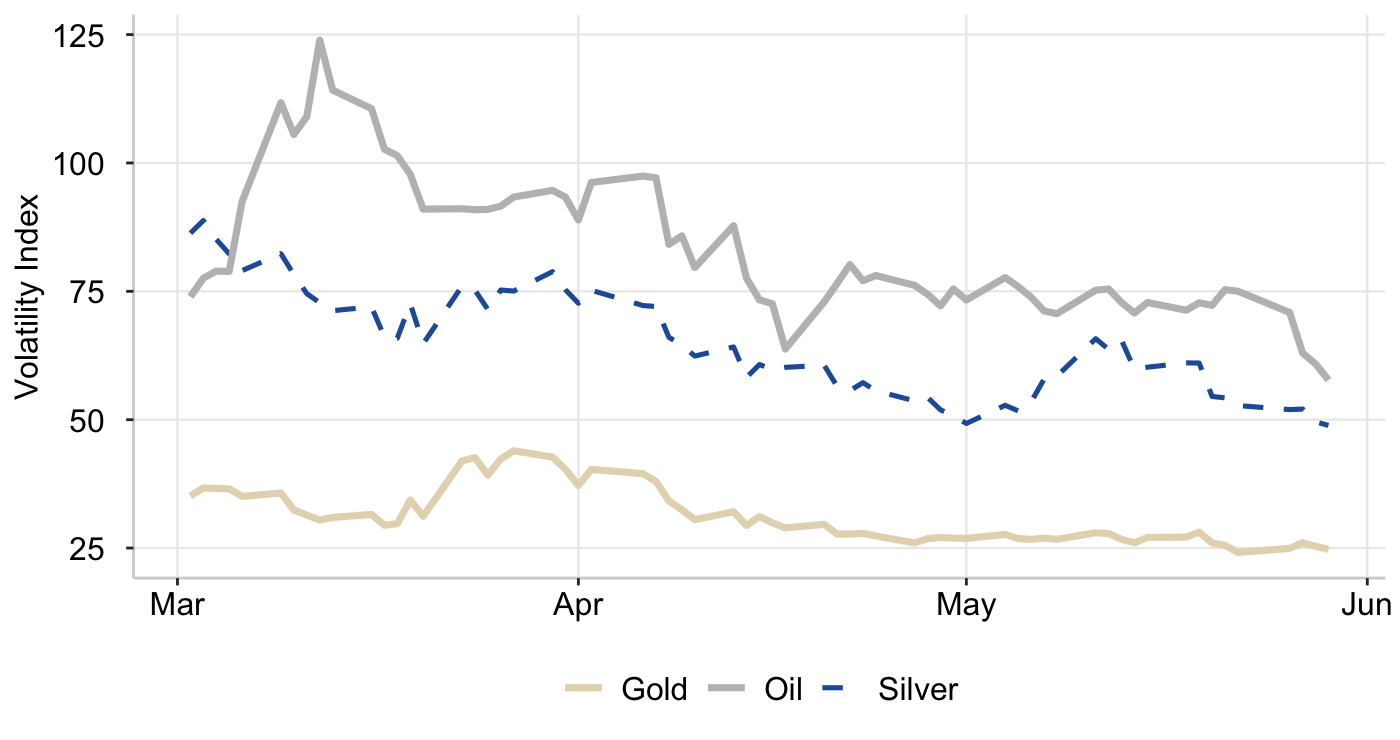
Gas prices have surged 28% over the past two months due to the U.S./Israel–Iran conflict, which has disrupted global energy markets and raised concerns about supply shocks stemming from the closure of the Strait of Hormuz. Oil prices have fluctuated sharply in response to war-related headlines, with WTI crude reaching a high of $106.42 per barrel before falling to a low of $88.02 by month-end. Elevated energy prices are beginning to create demand destruction, as consumers drive less, travel less, and reduce discretionary spending in other areas of the economy.
Gold is being pulled in two opposite directions, with geopolitical risk supporting prices while elevated interest rates and inflation concerns limit further upside. Gold has fallen more than 15% since the beginning of the conflict, as higher Treasury yields have increased the opportunity cost of holding a non-interest-bearing asset. However, gold has recently regained strength as central banks, including the People's Bank of China, continue to purchase large amounts, signaling long-term confidence in the metal.
Graph 4: CBOE Commodities ETF Volatility Index
Source: CBOE
Investors have also begun accumulating gold in anticipation of a potential post-conflict rally. At the same time, a weakening U.S. dollar has made gold more affordable for foreign buyers, providing additional support for prices. Despite concerns about higher interest rates, gold climbed to $4,700 per ounce before becoming range-bound around $4,500.
Silver remained highly volatile and rose 7.1% in one day to $87 per ounce, breaking through key resistance levels as hedge funds, leveraged traders, and trend-following investors increased their exposure. In addition to strong speculative demand, silver continues to benefit from its industrial applications, particularly in AI infrastructure, data center expansion, and electronics production. These structural demand drivers have provided further support for prices despite broader market uncertainty.
Decentralized Finance (DeFi) Outlook
Cryptocurrencies
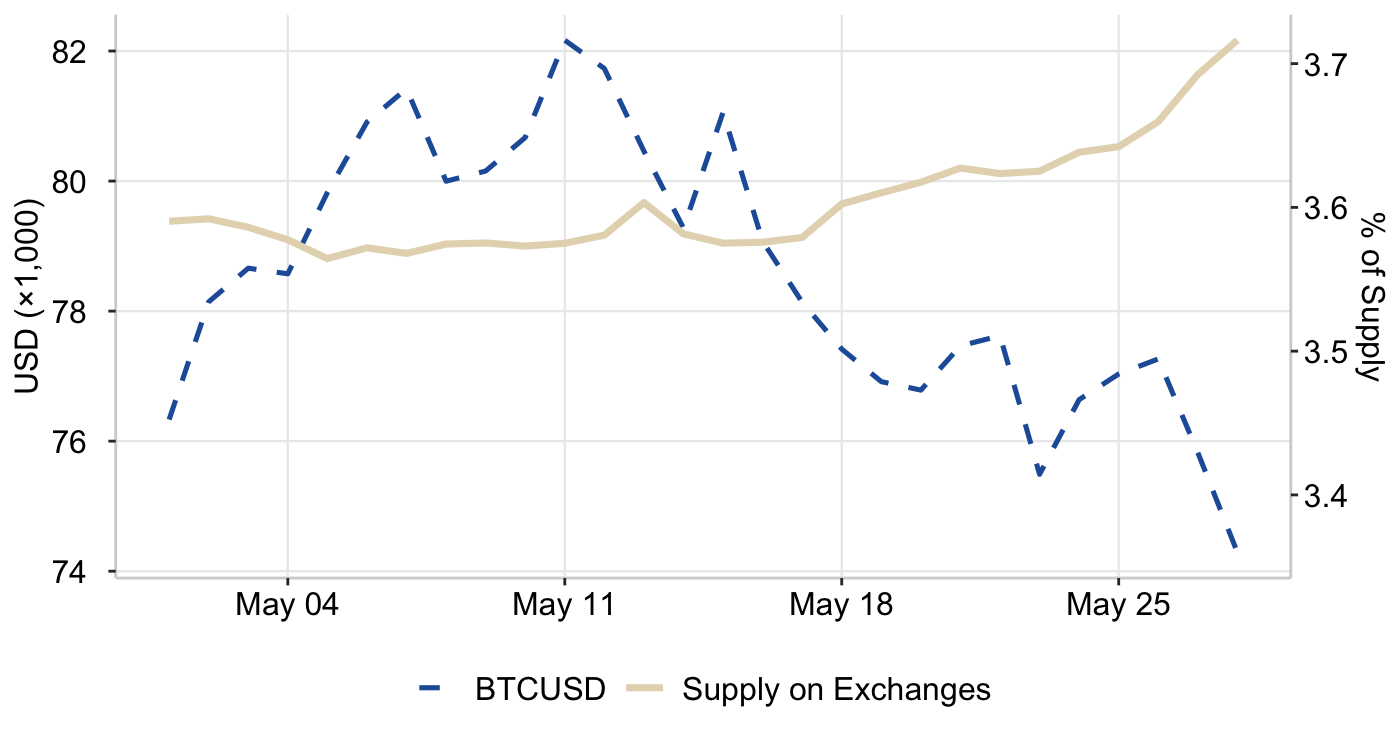
Crypto has continued to trade like a high-risk growth asset closely tied to liquidity conditions and overall market sentiment. After rising to $82,000, Bitcoin (BTC) has become range-bound between $76,000–77,000 as investors rotated toward less risky assets. Additionally, Bitcoin ETFs recorded $2.1 billion in outflows during May, including $331 million in a single day, as large institutional investors reduced exposure to Bitcoin. In contrast, alternative assets such as Solana and XRP saw inflows, as investors positioned themselves into smaller ecosystems with greater upside potential. However, the Bitcoin Volatility Index fell to its lowest level in nine months at 36.11, suggesting the coin could rebound quickly if bond yields stabilize or decline.
With interest rates potentially remaining higher for longer and U.S. Treasuries offering yields near 5%, capital has been flowing out of crypto, growth stocks, and other risk assets into government bonds. This broader weakness has impacted the entire crypto market, with Ethereum (ETH) also declining from $2,500 to $2,100. Moreover, approximately $870 million in bullish crypto positions were liquidated within 24 hours as overleveraged traders were forced to sell.
Graph 5: BTCUSD & Percentage of Supply on Exchanges
Source: Thetie
Bitcoin is down over one-third from its $126,000 peak, and is causing fee-driven businesses like Coinbase to see less trading volume and revenue, making the firm lay off 14% of its employees. Moreover, Tether bought SoftBank’s stake in Twenty One Capital, gaining more control over the struggling Bitcoin investment company. Morgan Stanley is launching its own crypto spot trading, and making it available to 8.6M of its clients. They are charging 0.50% per trade which is cheaper than competitors. Traditional banks are no longer seeing DeFi as competition, but instead as infrastructure.
The Clarity Act passed an important early vote but still faces obstacles. The biggest challenges are divided Democrats, politicians profiting from crypto, criminal loopholes and the banking industry opposition to stablecoins. If passed, the bill could provide long-awaited regulatory clarity and help legitimize the crypto industry in the US.
Stablecoins
Stablecoins are cryptocurrencies that are commonly held because they offer lower volatility than Bitcoin and Ethereum, allowing users to preserve capital while remaining active on-chain. RAAC issues its own stablecoin, Precious-Metal USD (pmUSD), which operates on the Ethereum blockchain.
Table 3: 1 Month Market Capitalization
| Stablecoin | Position | Market Capitalization |
|---|---|---|
 pmUSD pmUSD |
56 | $83.6M |
 USDT USDT |
1 | $188.69B |
 USDC USDC |
2 | $76.28B |
 PYUSD PYUSD |
7 | $3.12B |
 crvUSD crvUSD |
28 | $246.99M |
 frxUSD frxUSD |
44 | $131.75M |
 OUSD OUSD |
151 | $5.19M |
Source: DefiLlama
The Ethereum network hosts approximately $161.03 billion in stablecoin supply, representing roughly 50.1% of the global market, and continues to serve as the dominant blockchain for stablecoin issuance and activity. U.S. dollar–pegged stablecoins Tether (USDT) and USD Coin (USDC) remain the largest within the ecosystem, accounting for 80.9% of the activity.
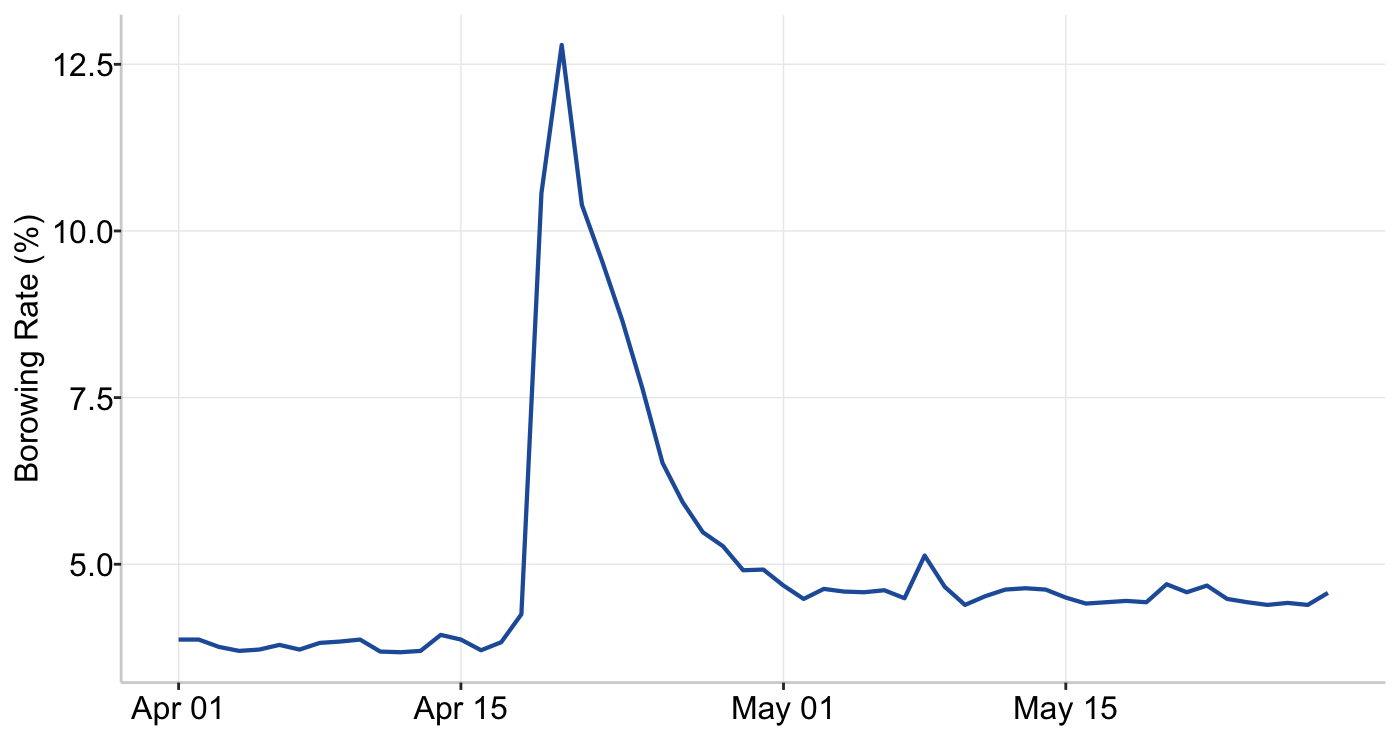
The Ethereum stablecoin borrowing rate represents the average cost of borrowing across lending protocols on the Ethereum network. After an initial spike in April, the borrowing rate has now subdued this month and is ranging 5.13% to 4.39%, showcasing reduced risk sentiment across the Ethereum ecosystem.
Graph 6: Ethereum Stablecoin Borrowing Rate
Source: Blockworks
The country whose currency dominates stablecoins may ultimately dominate global digital finance. Currently, approximately 99% of stablecoins are U.S. dollar-denominated, and with President Trump's ongoing efforts to regulate and legitimize the sector, the U.S. views stablecoins as a strategic tool to reinforce the dollar’s global role. The GENIUS Act represents the first major U.S. regulatory framework for stablecoins and is widely seen as an opportunity to extend dollar dominance into the digital economy. Unlike central bank digital currencies (CBDCs), such as those being developed in China, the U.S. approach relies on private-sector stablecoins that can modernize payments, increase global demand for dollars, and create additional demand for U.S. Treasuries.
At the same time, Europe is developing its own digital currency infrastructure. A consortium of European banks is preparing to launch a euro-backed stablecoin through Qivalis, an Amsterdam-based company supported by 37 financial institutions across 15 countries. The initiative is positioned as a response to U.S. dominance in digital payments and as a foundation for future blockchain-based trading of real-world assets. Meanwhile, the European Commission has launched a public consultation on the stablecoin provisions within MiCA, including whether the current ban on interest-bearing stablecoins should be reconsidered.
RAAC Outlook
Precious-Metal USD (pmUSD)
Precious-Metal USD (pmUSD) is RAAC’s stablecoin, designed to bridge hard-asset collateral with decentralized finance liquidity. pmUSD is backed by gold through tokenized in-situ precious metals reserves. Its issuance is backed by $121.98 million in collateral provided by I-ON Corporation, giving investors exposure to a fully collateralized, gold-backed digital asset on-chain while unlocking secure platforms to earn yield on tokenized gold. With a market capitalization of approximately $100 million, pmUSD currently ranks as the 52nd largest stablecoin by market value.
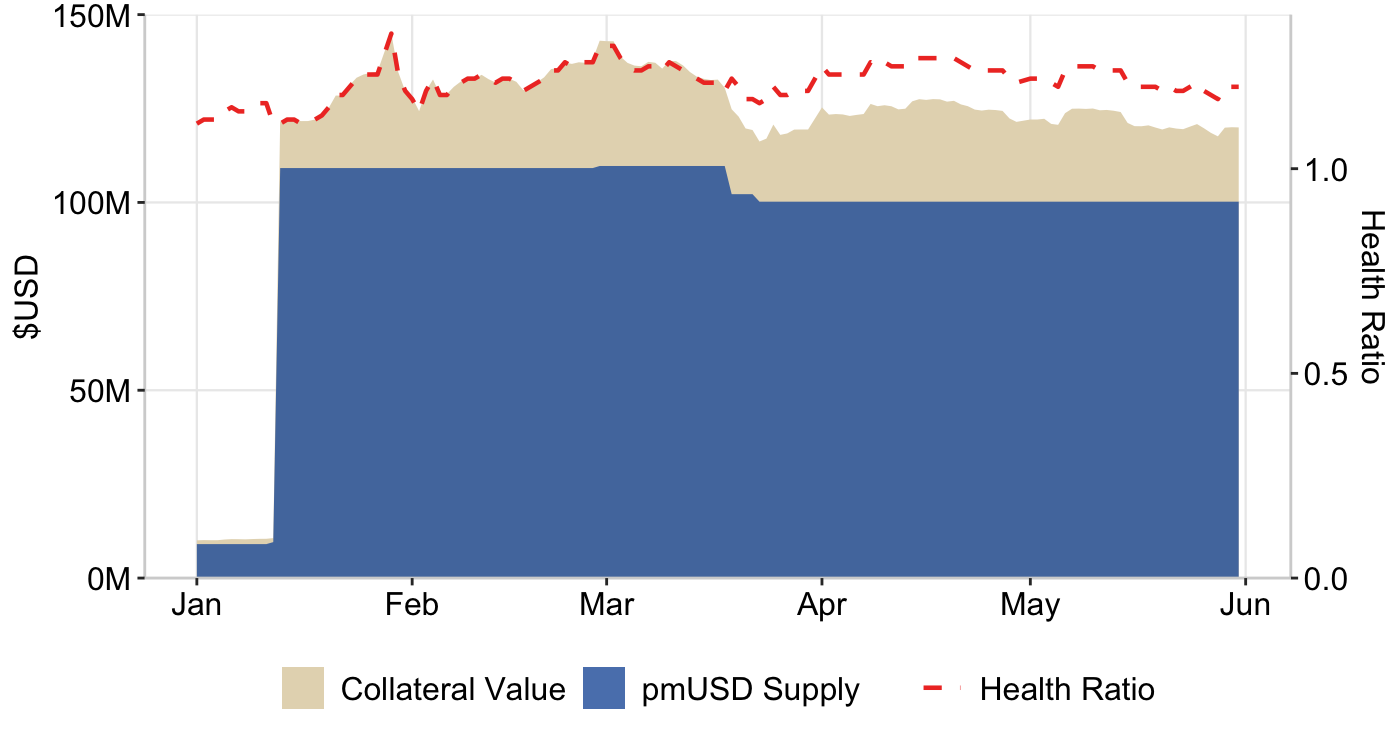
Though gold prices have been depreciating, RAAC maintains a stable health ratio relative to its collateral value and circulating supply of pmUSD. Through May, the collateral value averaged $ 121.51 million with a pmUSD supply of $100.2 million.
Table 7: Collateral vs pmUSD supply
Source: https://dune.com/4sh4/raac-pmusd
Early in the month, concerns regarding the legitimacy of pmUSD’s gold collateral emerged, negatively impacting both the tokens and protocols reputation. As market confidence weakened, pmUSD depegged from its $1.00 USD target. After overcoming institutional timing constraints, RAAC was able to introduce a redemption plan that has supported an ongoing repeg of pmUSD, while the team continues to pursue additional liquidity initiatives aimed at fully restoring the peg.
The redemption system is expected to go live during the week of July 6, 2026, allowing pmUSD holders to redeem their tokens through two established precious metals dealers, APMEX and Kitco. RAAC is also working to onboard additional redemption partners, reducing reliance on any single provider and strengthening the protocol’s long-term redemption infrastructure. As a result, holders now have a clear pathway to convert their digital assets into physical gold-related value through recognized market participants.
$iREET
The Index Real Estate Token ($iREET) is RAAC’s tokenized real estate index, establishing RAAC among the best DeFi products backed by real estate in 2026. Designed to give users liquid, diversified exposure to real-world real estate on-chain, it positions RAAC as one of the most transparent real asset lending platforms on-chain. By depositing a REET NFT into the index, users receive $iREET tokens representing a proportional share of the index’s net asset value (NAV).
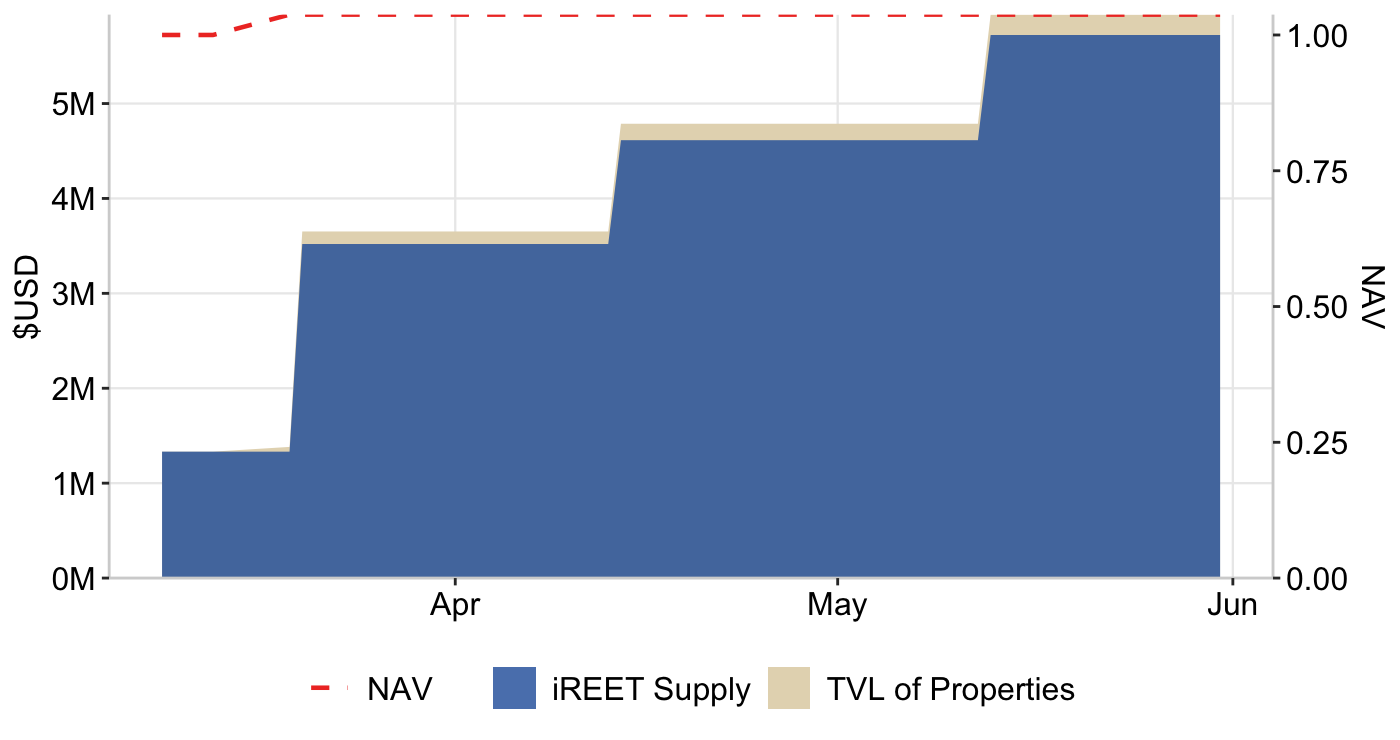
Graph 8: NAV per $iREET
Source: Dune
Notes: NAV per $iREET = TVL / Circulating Supply
$iREET is a tangible real-estate backed stablecoin and RAAC has continuously been acquiring properties to increase the value of $iREET. The $iREET vault currently holds 17 properties, with a combined value of $5.94 million, supporting a total circulating supply of 5.72 million $iREET tokens with NAV per iREET at $1.0375. Moreover, the properties generate $41,900 in monthly rent which flows back into the RAAC ecosystem.
Currently, $iREET is trading below its NAV due to temporary liquidity constraints. This discount was driven by pmUSD’s depeg and the resulting imbalance in the iREET/pmUSD Curve pool, rather than any deterioration in the value of the underlying real estate assets. RAAC is actively monitoring the situation and continues to work on long-term solutions aimed at restoring the pmUSD peg and improving overall market liquidity.
In April, RAAC partnered with ApeBond to launch a $1.135 million $iREET bond program. These bonds have now matured, giving participants several options: they can continue holding $iREET, swap into pmUSD, provide liquidity, or use $iREET as collateral within the upcoming RAACLend ecosystem.
Glimpse into the Curve Wars
RAAC is built directly within Curve Finance and actively participates in the Curve Wars—the ongoing competition to control governance power within the protocol. By locking CRV tokens, participants receive vote-escrowed CRV (veCRV), which grants voting rights to determine which liquidity pools receive reward emissions, ultimately shaping yield levels and liquidity depth. Protocols such as Convex Finance and Stake DAO have accumulated significant veCRV positions and, through their own tokens, offer alternative pathways to access Curve governance power.
The Kingmaker Ratio is a RAAC-specific metric used to evaluate whether acquiring veCRV directly or accumulating voting power through another protocol is the most efficient strategy per dollar. The metric is defined as:
Kingmaker Ratio = veCRV/$ via protocol iveCRV/$ via CRV
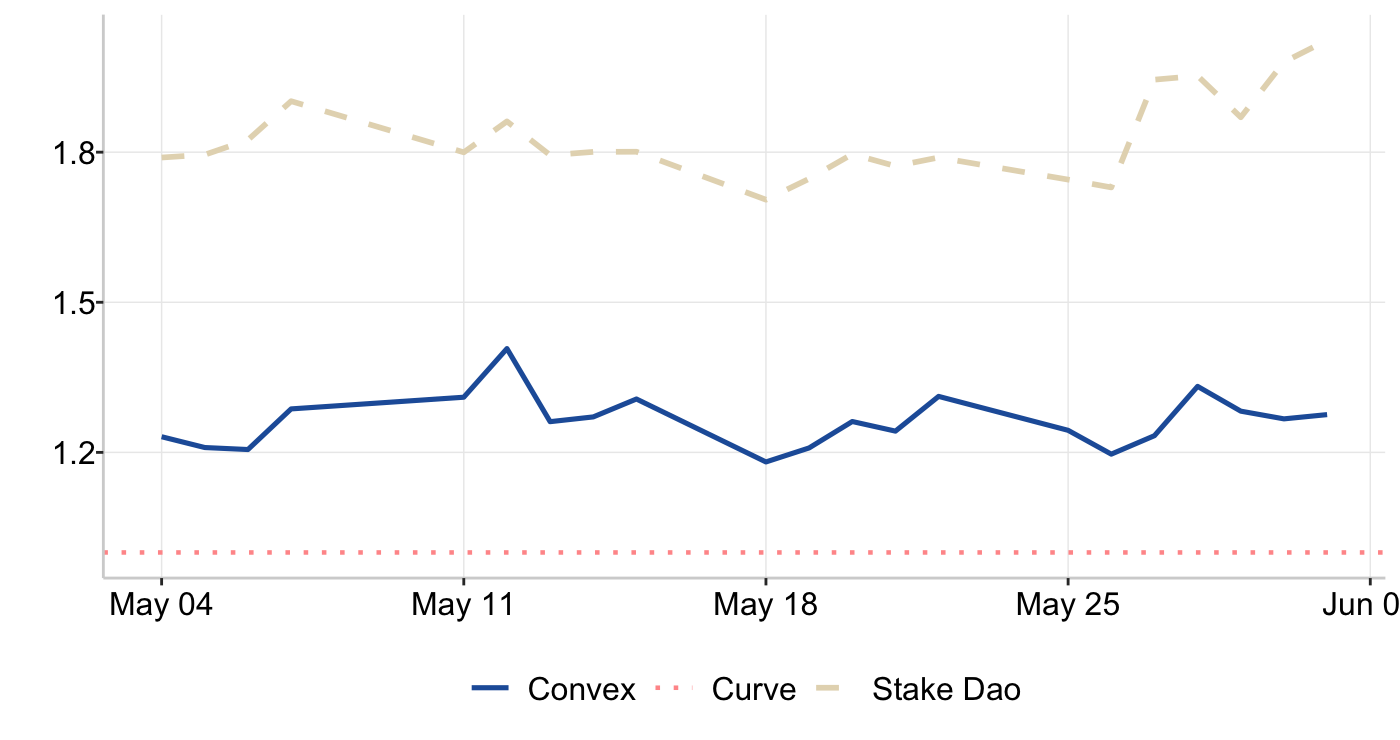
Using the above equation, separate ratios are calculated for Curve (veCRV), Convex (vlCVX), and StakeDao (sdCRV + veSDT). Graph 8 tracks the evolution of these ratios over the month of May, highlighting changes in relative efficiency across each strategy.
Graph 9: Kingmaker Ranking
Source: buycvxcorrect.netlify.app
The ratios for vlCVX and (sdCRV + veSDT) both remain above the 1.00 threshold, indicating that acquiring voting power through these alternative strategies is more efficient than directly purchasing veCRV. However, Stake DAO maintains the higher ratio, providing greater voting power per $1 spent compared to Convex.
To date, RAAC has leveraged the Convex strategy, which has still enabled significant voting influence, making it the fourth-largest governance participant. This positioning allows RAAC to consistently direct emissions toward its own liquidity pools, creating a structural advantage that supports RAAC being a top real-world asset Defi platform for stable yield.
Liquidity pools
RAAC has 4 liquidity pools active on Curve Finance:
- pmUSD/crvUSD - Launched Dec 25, 2025
- pmUSD/frxUSD - Launched Dec 25, 2025
- pmUSD/OUSD - Launched Feb 28, 2026
- iREET/pmUSD - Launched Mar 12, 2026
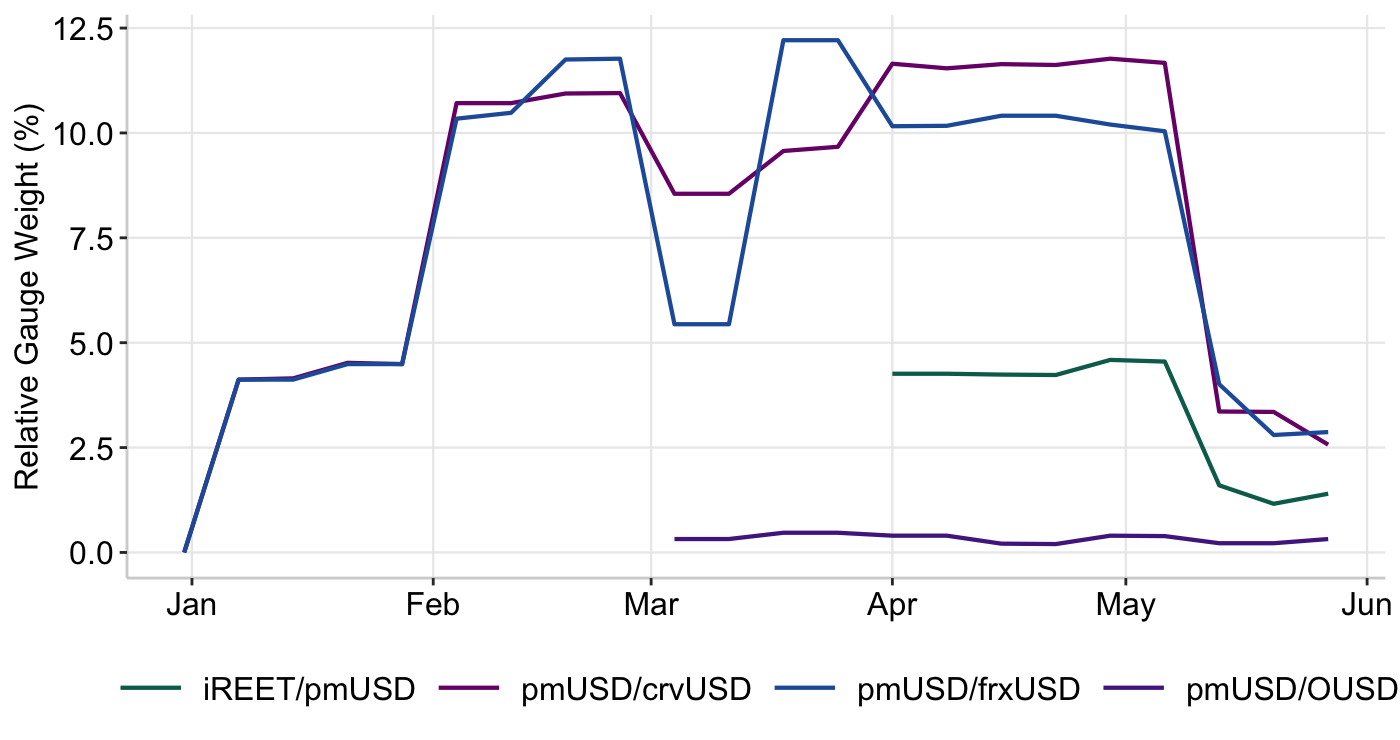
RAAC is built on the existing Curve Finance infrastructure and ecosystem, including active participation in the Curve Wars. Through this participation, RAAC has directed liquidity to its Curve pools. Graph 10 illustrates the relative gauge weight of RAAC’s liquidity pools within the Curve Finance ecosystem.
Graph 10: RAAC Curve Pools - Gauges
Source: curve.finance
pmUSD/crvUSD and pmUSD/frxUSD received the highest vote allocations early month, but the weight did decline as RAAC chose not to push additional incentives toward external voters, which temporarily reduced the influence. RAAC has a base gauge weight of approximately 4.5% from its own voting power. Current emissions are around $21,000 USD per week expected to flow to RAAC pools. Even if RAAC provided no incentives, the pool would still receive roughly 98,845 CRV tokens per epoch/week because of its baseline gauge weight and voting power. Nonetheless, RAAC controls 4.49% of all veCRV voting power through CVX and remains the fourth largest governance power on Curve Finance, allowing users to participate in RAAC products with long-term confidence.
Figure 11: RAAC Curve Pools - Weighted Reward APY
Source: curve.finance
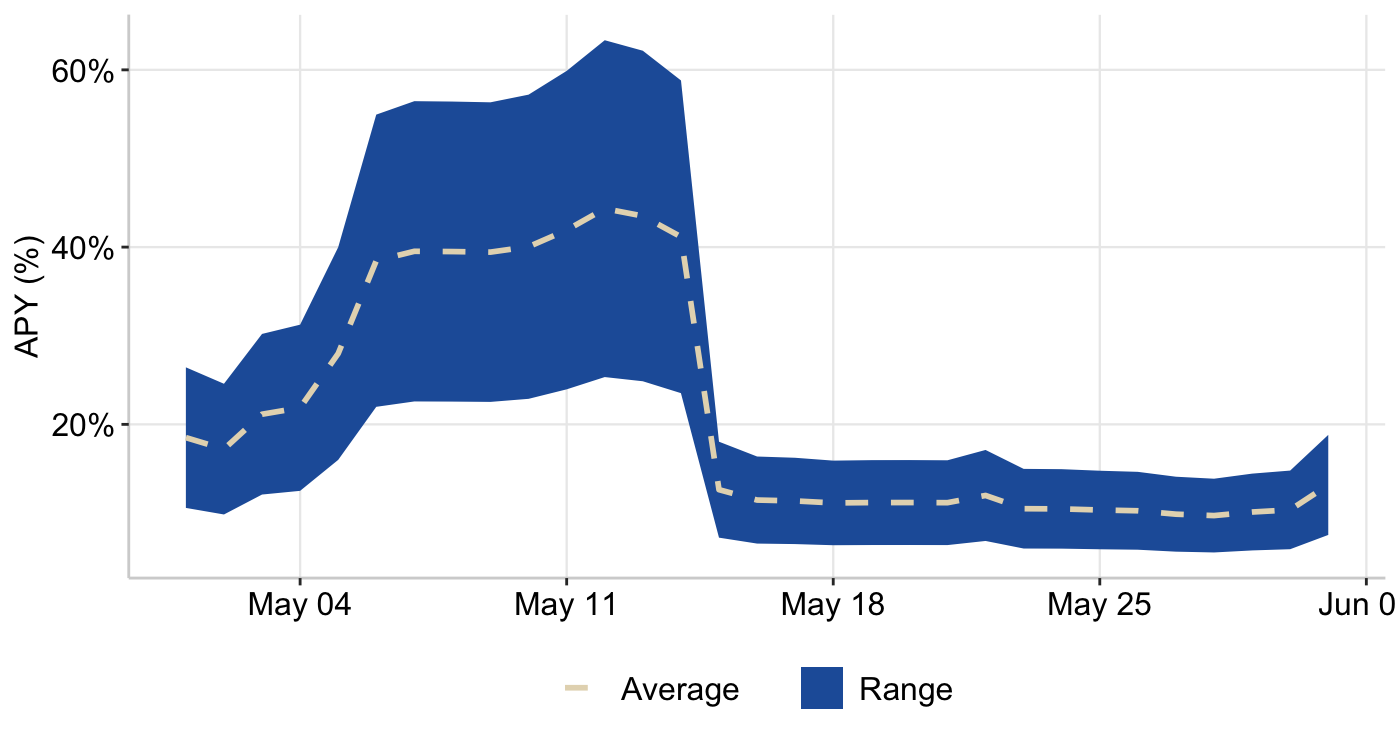
APY across the Curve pools is calculated as the amount of rewards distributed relative to the pool's TVL. Although liquidity was removed and TVL declined early in the month, the amount of rewards distributed by RAAC initially remained unchanged. As a result, APYs across all pools increased significantly, with the weighted reward APY across RAAC’s Curve liquidity pools ranging from 9% to 63%. However, by mid-month, a reduction in rewards combined with lower yields across the broader Curve ecosystem caused pool APYs to moderate, ranging between 5.5% and 18%.
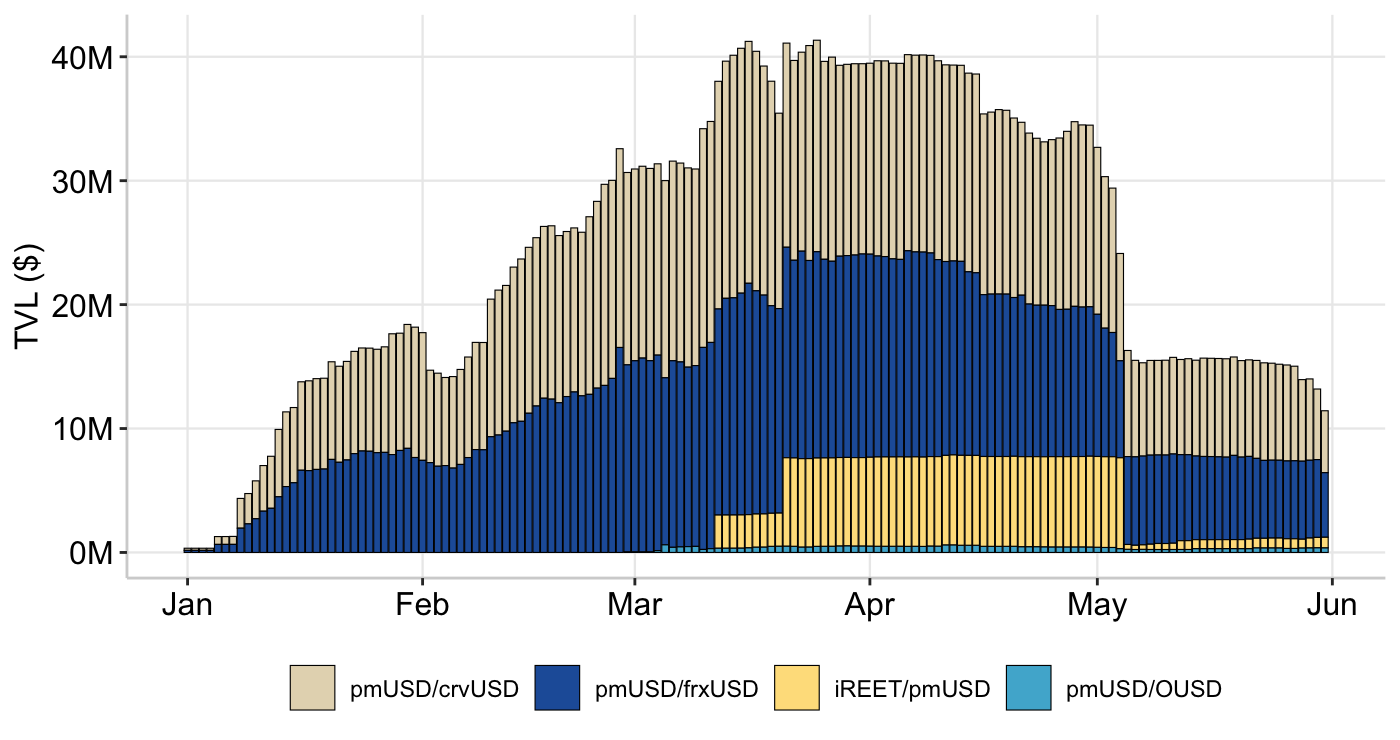
RAAC’s Curve pool total value locked (TVL) declined over the past month as weakened sentiment led some users to sell pmUSD. As part of its stabilization strategy, RAAC also actively removed liquidity to support the repeg process. While repegging remains ongoing, the combined TVL across RAAC’s Curve pools has declined to approximately $15 million.
Graph 12: RAAC Curve Pools - Total Volume Locked (TVL)
Source: https://dune.com/4sh4/raac-pmusd
Participants can further enhance their yields by depositing LP tokens into protocols such as Stake DAO, Convex Finance, Beefy Finance, and Yearn Finance to access boosted rewards. RAAC has also partnered with Royco Protocol and Euler Finance to further expand return opportunities for participants.
Resources
Data
https://tradingeconomics.com/indicators
https://fred.stlouisfed.org/series/DGS10
https://fred.stlouisfed.org/series/DGS5#
https://fred.stlouisfed.org/series/DGS30)
https://fred.stlouisfed.org/series/BAMLC0A0CM#
https://fred.stlouisfed.org/series/PRIME
https://fred.stlouisfed.org/series/MORTGAGE30US
https://app.koyfin.com/gyld
https://fred.stlouisfed.org/series/VIXCLS
https://defillama.com/stablecoins
https://www.coingecko.com
https://www.cboe.com/us/indices/dashboard/ovx-GVZ/
https://www.cboe.com/us/indices/dashboard/ovx/
https://www.convexfinance.com/
https://dune.com/4sh4/raac-pmusd
https://www.curve.finance/dao/ethereum/gauges
https://www.curve.finance/dex/ethereum/pools?search=pmusd
https://www.stakedao.org/yield?search=pmusd
https://curve.convexfinance.com/stake
https://app.beefy.com/
https://yearn.fi/vaults?type=lp&search=pmusd
https://app.morpho.org/ethereum/market/0x72cc79433e9f91c2a185422725510f4bdd19c9006010f464f851468b2371b756/srroyusdc-pmusd?tab=market#advanced
News
https://www.reuters.com/business/finance/euro-stablecoin-project-adds-25-new-banks-2026-05-20/
https://www.tradingview.com/news/cointelegraph:133dbbbbf094b:0-eu-opens-consultation-on-mica-stablecoin-rules-and-defi-gaps/
https://www.bloomberg.com/news/articles/2026-05-03/us-futures-gain-oil-falls-on-signs-of-iran-talks-markets-wrap
https://www.bloomberg.com/news/articles/2026-05-04/asian-stocks-set-to-fall-as-gulf-tensions-lift-oil-markets-wrap
https://www.bloomberg.com/news/articles/2026-05-05/asian-stocks-to-track-us-gains-on-truce-optimism-markets-wrap
https://www.bloomberg.com/news/articles/2026-05-07/us-stock-futures-fall-oil-climbs-on-iran-tensions-markets-wrap
https://www.bloomberg.com/news/features/2026-05-04/global-crypto-race-why-divided-europe-is-losing-ground
https://www.bloomberg.com/news/articles/2026-05-05/coinbase-to-cut-14-of-workforce-citing-volatile-markets-ai
https://www.bloomberg.com/news/articles/2026-05-05/stephen-jen-warns-of-fiscal-risk-to-us-dollar-bond-haven-status
https://www.bloomberg.com/news/articles/2026-05-08/treasuries-gain-ahead-of-us-payrolls-with-jobs-growth-expected?srnd=phx-markets
https://www.bloomberg.com/news/articles/2026-05-06/morgan-stanley-debuts-crypto-trading-undercuts-rivals-on-price
https://www.bloomberg.com/news/articles/2026-05-07/us-yields-at-5-tug-traders-between-dip-buying-greed-and-fear
https://www.bloomberg.com/news/articles/2026-05-07/us-stock-futures-fall-oil-climbs-on-iran-tensions-markets-wrap
https://www.bloomberg.com/news/articles/2026-05-07/gold-steadies-as-us-iran-clashes-dim-truce-prospects-in-mideast
https://www.bloomberg.com/news/articles/2026-05-10/gold-falls-as-trump-rejection-of-iran-offer-fans-inflation-fears
https://www.bloomberg.com/news/articles/2026-05-11/asia-stocks-to-gain-oil-rises-on-us-iran-deadlock-markets-wrap
https://www.bloomberg.com/news/articles/2026-05-12/asian-stocks-under-pressure-as-us-inflation-rises-markets-wrap
https://www.bloomberg.com/news/articles/2026-05-13/treasury-buyers-get-5-long-bond-rate-for-first-time-since-2007
https://www.bloomberg.com/news/articles/2026-05-13/asian-stocks-to-climb-as-wall-street-hits-new-high-markets-wrap
https://www.bloomberg.com/news/articles/2026-05-15/inflation-risk-gives-corporate-bonds-the-edge-over-sovereigns
https://www.bloomberg.com/news/articles/2026-05-20/us-mortgage-rates-rose-to-almost-two-month-high-in-latest-week
https://finance.yahoo.com/markets/crypto/articles/bitcoin-struggles-bond-yields-rise-131200806.html
https://news.bitcoin.com/blackrock-drives-331m-bitcoin-etf-outflow-as-xrp-and-solana-funds-attract-inflows/
https://thehill.com/policy/technology/5885518-clarity-act-senate-challenges/
https://www.bloomberg.com/news/articles/2026-05-17/oil-climbs-as-iran-war-shows-no-sign-of-ending-markets-wrap
https://www.bloomberg.com/news/articles/2026-05-18/oil-slips-as-trump-spurs-optimism-over-iran-deal-markets-wrap
https://www.bloomberg.com/news/articles/2026-05-18/gold-holds-gain-as-hopes-for-iran-truce-ease-inflation-fears
https://www.bloomberg.com/news/articles/2026-05-17/bond-traders-see-tipping-point-toward-new-era-of-higher-yields
https://www.bloomberg.com/news/articles/2026-05-19/asian-stocks-to-track-us-drop-on-inflation-fears-markets-wrap
https://www.bloomberg.com/news/articles/2026-05-20/tether-buys-out-softbank-stake-in-bitcoin-treasury-firm
https://www.bloomberg.com/news/articles/2026-05-21/repeat-after-me-stocks-are-not-an-effective-inflation-hedge
https://www.bloomberg.com/news/articles/2026-05-22/how-stablecoins-became-part-of-america-s-dollar-strategy
https://www.bloomberg.com/news/articles/2026-05-24/oil-dollar-slide-on-optimism-over-us-iran-deal-markets-wrap
https://www.bloomberg.com/news/articles/2026-05-26/treasuries-rally-as-trump-signals-progress-in-iran-negotiations
https://www.bloomberg.com/news/articles/2026-05-25/asian-stocks-set-to-extend-gains-on-us-iran-hopes-markets-wrap
https://www.bloomberg.com/news/articles/2026-05-26/bitcoin-btc-volatility-hits-nine-month-low-as-crypto-takes-breather
https://www.bloomberg.com/news/articles/2026-05-26/asian-stocks-set-to-rise-as-iran-deal-hopes-hold-markets-wrap
https://www.bloomberg.com/news/articles/2026-05-27/stocks-in-asia-to-slip-on-mixed-us-iran-signals-markets-wrap
https://www.bloomberg.com/news/articles/2026-05-28/bitcoin-falls-to-five-week-low-amid-war-jitters-etf-outflows
https://www.bloomberg.com/news/articles/2026-05-27/goldman-says-iran-war-dollar-surge-weighed-on-treasury-demand
https://www.bloomberg.com/news/articles/2026-05-21/iran-war-spurs-extreme-bear-scenarios-for-asia-currencies-bonds